Do sophisticated asset allocation strategies beat simple ones? In the December 2010 version of their paper entitled “Risk Parity Portfolio vs. Other Asset Allocation Heuristic Portfolios”, Denis Chaves, Jason Hsu Feifei Li and Omid Shakernia conduct a horse race among six asset allocation weighting strategies applied to nine asset classes:
- 60/40: 60% S&P 500 Index/40% Barclays Capital U.S. Aggregate Bond Index.
- U.S. Pension Model: 55% stocks (80% U.S. and 20% international); 35% bonds (60% U.S. Long Treasury, 20% investment-grade corporate and 20% global); and, 10% alternative investments (2.5% each commodities, REITs, emerging market equities and high-yield bonds).
- Equal: simple equal weight for all nine asset classes.
- Risk Parity: equal volatility contribution for all nine asset classes (asset classes contribute equally to expected portfolio fluctuations).
- Mean-Variance: mean-variance optimization based on a five-year rolling return history.
- Minimum-Variance: like mean-variance optimization but using only variances and ignoring returns, based on a five-year rolling return history.
The nine asset classes proxies are: Barclay’s Capital U.S Long Treasury Index; Barclay’s Capital U.S. Investment Grade Corporate Bond Index; J.P. Morgan Global Goernment Bond Index; Barclay’s Capital U.S. High Yield Corporate Bond Index; S&P 500 Index; MSCI EAFE Index; MSCI Emerging Market Index; Dow Jones UBS Commodity Index; and, FTSE NAREIT US Real Estate Index. Using annual and monthly data as available for these indexes over the period January 1980 through June 2010, they find that:
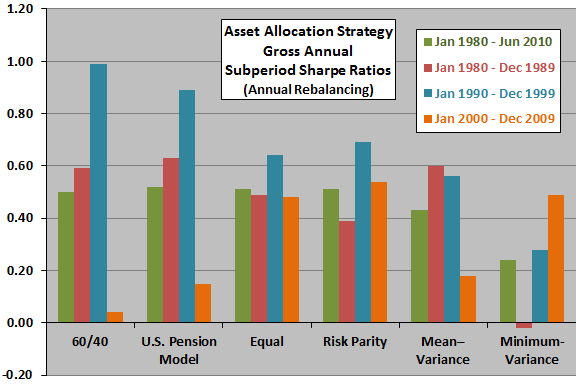
- While the Risk Parity strategy does not consistently outperform on a risk-adjusted (Sharpe ratio) basis the Equal or U.S. Pension Model strategies, it does significantly and consistently outperform Minimum-Variance and Mean-Variance strategies (see the chart below).
- Although Risk Parity performs on par with equal weighting, it does provide better diversification in terms of risk allocation and, thus, warrants further consideration as an asset allocation strategy.
- However, we show that the Risk Parity strategy’s performance can be highly dependent on the investment universe. Thus, to execute on Risk Parity successfully, careful selection of asset classes is very critical and, for the time being, remains an art rather than a science.
The following chart, constructed from data in the paper, compares overall and subperiod gross annual Sharpe ratios for six asset allocation strategies applied to the nine indexes selected as asset class proxies. Results indicate that the very simple Equal strategy and the Risk Parity strategy produce the most consistent risk-adjusted performance over the last 30 years.

In summary, evidence from a 30-year horse race indicates that a very simple equal weighting asset allocation strategy is about as good as any other simple or complex strategy.
Cautions regarding findings include:
- The sample period is not long relative to potential secular socioeconomic trends (such as disinflation since 1980).
- Return calculations are gross, not net. Including reasonable costs for constructing annual portfolios tracking these indexes would reduce reported returns. Costs may be substantial for illiquid asset classes.
- Statistical methods generally assume tame return distributions. To the extent distributions are wild, interpretation of resulting statistics breaks down.