Is risk for long-term investors different from that for short-term investors? In his July 2014 paper entitled “Rethinking Risk (II): The Size and Value Effects”, Javier Estrada examines the riskiness of small stocks versus large stocks and value (high book-to-market ratio) stocks versus growth stocks based on conventional and unconventional metrics. Each year during 1927 through 2013, he makes initial investments of $100 in Fama-French small, large, value and growth stock portfolios and holds for 20 or 30 years to generate distributions of 68 or 58 terminal wealths for each style, respectively. He then calculates the following metrics for these two sets of portfolios:
- Mean (average) of terminal wealths by style.
- Median (midpoint) of terminal wealths by style.
- Average of the standard deviations of annual returns (SDD) by style.
- Standard deviation of the terminal wealths (SDE) by style.
- Lower‐tail Terminal Wealth (LTWx), the average terminal wealth in the lower x% of the distribution of terminal wealths (with x% being 1%, 5% or 10%) by style.
- Upper‐tail Terminal Wealth (UTWx), the average terminal wealth in the upper x% of the distribution of terminal wealths (with x% again being 1%, 5% or 10%) by style.
SDD is most like conventional risk (volatility), while the other metrics focus unconventionally on terminal wealth. Using annual gross total returns for Fama‐French U.S. style portfolios during 1927 through 2013, he finds that:
- An investor concerned mostly about gross volatility, either during (SDD) or at the ends of (SDE) holding periods, would agree with the conventional wisdom that small-stock portfolios are riskier than large-stock portfolios, and value-stock portfolios are riskier than growth-stock portfolios.
- An investor focused on gross long‐term terminal wealth would disagree, because small-stock and value-stock portfolios offer better typical outcomes, more upside potential and better downside protection than do large-stock and growth-stock portfolios, respectively (see the charts below).
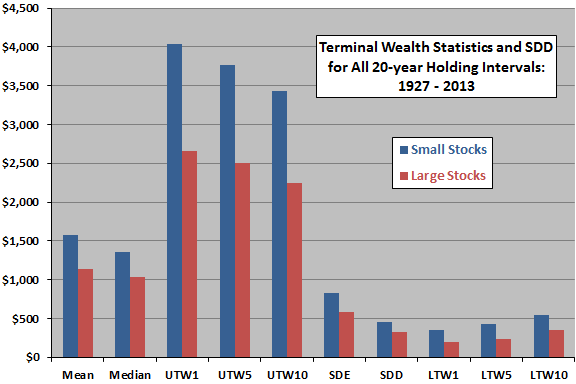
The following chart, constructed from data in the paper, summarizes gross values of the above statistics across 68 overlapping 20-year holding intervals for small-stock and large-stock portfolios. Results indicate that:
- Interim annual volatility (SDD) and variability of terminal values (SDE) are higher for small stocks than large stocks.
- Typical (mean and median) outcome tends to be better for small stocks than large stocks.
- Upside potential (UTWx) and downside protection (LTWx) tend to be better for small stocks than large stocks.
Results for 58 30-year holding intervals are similar.

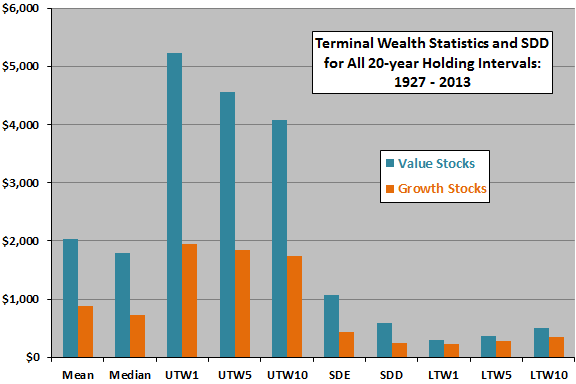
The next chart, also constructed from data in the paper, summarizes gross values of the above statistics across 68 overlapping 20-year holding intervals for the value-stock and growth-stock portfolios. Results indicate that:
- Interim annual volatility (SDD) and variability of terminal values (SDE) are higher for value stocks than growth stocks.
- Typical (mean and median) outcome tends to be better for value stocks than growth stocks.
- Upside potential (UTWx) and downside protection (LTWx) tend to be better for value stocks than growth stocks.
Again, results for 58 30-year holding intervals are similar.

In summary, evidence suggests that conventional risk (volatility) may conflict with lifetime outcome (terminal wealth) in choosing equity styles.
Cautions regarding findings include:
- Samples are very small in terms of independent 20-year and 30-year holding intervals. Also, use of highly overlapping intervals can distort statistics.
- The study does not account for trading frictions implied by periodic rebalancing of portfolios to maintain styles. These frictions likely vary by style, such that net findings might differ from gross findings.
- The study does not account for the costs/feasibilities of shorting stocks with low expected returns in the Fama-French style portfolios. These costs/feasibilities likely vary by style, again such that net findings might differ from gross findings.
- For the samples of terminal wealth used, LTWx and UTWx are extremely small subsamples (LTW1 and UTW1 involve only one observation each).
See also the closely related “Long-term Investors: Focus on Terminal Wealth?”.