Does the relatively illiquid, opaque, retail environment of over-the-counter (OTC) stocks make them behave differently from comparable listed stocks? In their November 2010 paper entitled “The Cross Section of Over-the-Counter Equities”, Andrew Ang, Assaf Shtauber and Paul Tetlock test the abilities of market capitalization, book-to-market ratio, liquidity, return momentum and idiosyncratic volatility to predict OTC stock returns and compare results to those for listed stocks with comparable market capitalizations. As a part of the study, they examine hedge portfolios that are long/short extreme fifths of OTC stocks ranked by these characteristics to estimate of the magnitudes of the respective premiums. Using trading volumes, market capitalizations, book-to-market ratios (as available) and closing, bid and ask prices for a large sample of OTC-only firms with at least one Financial Industry Regulatory Authority market maker, and for comparable listed firms, during 1975 through 2008, they find that:
- Over the entire sample period, the gross average monthly return of OTC (comparably sized listed) stocks is -0.26% (0.69%).
- The average standard deviation of monthly returns for OTC (comparably sized listed) stocks is 6.80% (5.25%). The standard deviation of monthly returns across sampled OTC (comparably sized listed) stocks is 27.8% (19.3%).
- OTC stocks have a somewhat lower average book-to-market ratio, a much lower average trading volume and a markedly higher average bid-ask spread than comparably sized listed stocks.
- In general, regressions indicate that firm/stock characteristics have far greater predictive power for OTC stocks than for comparably sized listed stocks.
- Regardless of the liquidity measure used, the illiquidity premium is much higher for OTC stocks than for comparably sized listed stocks. For example, the gross annual premium indicated by a portfolio that is long (short) the fifth of stocks with the highest (lowest) fraction of days with zero volume during the preceding month (reformed monthly) is 21.5% for OTC stocks and 1.7% for comparably sized listed stocks.
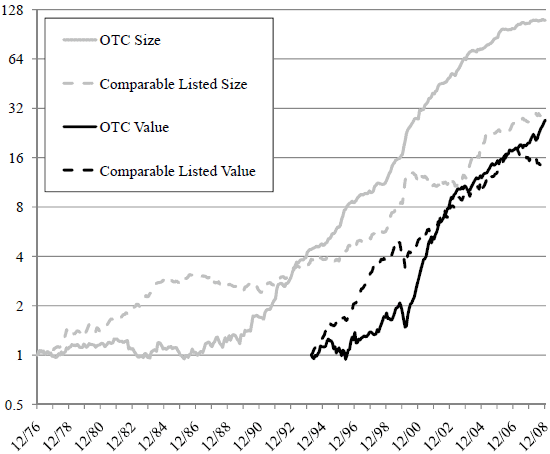
- The size effect and value premium are similar for OTC stocks and comparably sized listed stocks (see the chart below).
- However, the momentum effect and idiosyncratic volatility premium, while pronounced for comparably sized listed stocks, are small to non-existent for OTC stocks.
The following chart, taken from the paper, compares on a logarithmic scale the gross cumulative values of $1 initial investments from December 1976 through December 2008 in hedge portfolios exploiting the size effect and the value premium for OTC stocks and comparably sized listed stocks. The size portfolios are long (short) the fifth of stocks with the smallest (biggest) prior-month market capitalizations, weighted equally and reformed monthly. The value portfolios are long (short) the fifth of stocks with the highest (lowest) prior-month book-to-market ratios, widely available only after 1993, weighted equally and reformed monthly. As a risk adjustment, the authors scale OTC portfolio positions so that the volatility of the OTC portfolio is equal to that of comparably sized listed portfolio.
Results indicate that the size effect and value premium exist for OTC stocks, with risk-adjusted magnitudes roughly similar to those for comparably sized listed stocks.

In summary, evidence from multiple tests indicates that OTC stocks present at the gross level a much larger illiquidity premium, a similar size effect, a similar value premium, a much smaller momentum effect and a much smaller idiosyncratic volatility premium relative to comparably sized listed stocks.
Note that all return calculations in this study are gross. Monthly portfolio reformation implies considerable trading. OTC stocks have relatively large bid-ask spreads, and the impact on price of substantial trading in these stocks is not negligible. Accounting for reasonable trading friction would materially diminish the estimated gross premiums, and plausibly could eliminate or reverse them.