How many, and which, factors should investors include when constructing multi-factor smart beta portfolios? In their August 2017 paper entitled “How Many Factors? Does Adding Momentum and Volatility Improve Performance”, Mohammed Elgammal, Fatma Ahmed, David McMillan and Ali Al-Amari examine whether adding momentum and low-volatility factors enhances the Fama-French 5-factor (market, size, book-to-market, profitability, investment) model of stock returns. They consider statistical significance, economic sense and investment import. Specifically, they:
- Determine whether factor regression coefficient signs and values distinguish between several pairs of high-risk and low-risk style portfolios (assuming stock style portfolio performance differences derive from differences in firm economic risk).
- Relate time-varying factor betas across style portfolios to variation in economic and market risks as proxied by changes in U.S. industrial production and S&P 500 Index implied volatility (VIX), respectively.
- Test an out-of-sample trading rule based on extrapolation of factor betas from 5-year historical rolling windows to predict next-month return for five sets (book-to-market, profitability, investment, momentum, quality) of four style portfolios (by double-sorting with size) and picking the portfolio within a set with the highest predicted returns.
Using monthly factor return data during January 1990 through October 2016, they find that:
- Regarding power of factor regressions to distinguish riskiness of style portfolios:
- The 5-factor model does not materially improve the conventional Fama-French 3-factor (market, size, book-to-market) model in terms of explaining style portfolio behaviors.
- Momentum and volatility factors do not improve the 5-factor model.
- Links between changes in economic and market risks and time variation of factor betas are weak, but stronger among small stocks than large stocks.
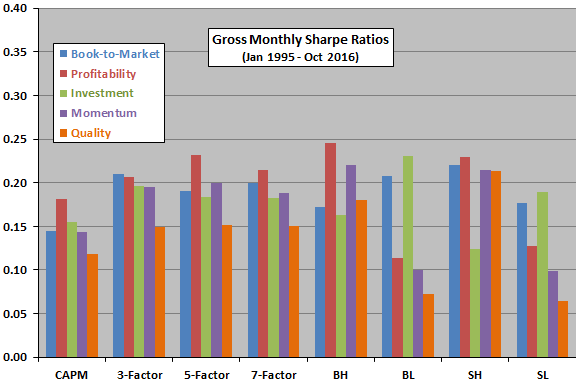
- Based on the trading rule tests during January 1995 through October 2016 (see the chart below):
- The 3-factor model is superior to the 1-factor (market) Capital Asset Pricing Model (CAPM).
- The 5-factor model does not clearly outperform the 3-factor model.
- The 7-factor model often underperforms both 3-factor and 5-factor models.
The following chart, constructed from data in the paper, compares gross monthly Sharpe ratios for eight variations of five factor portfolios (book-to-market, profitability, investment, momentum, quality), as follows:
- BH – each month, hold big-capitalization stocks with high values of the factor beta.
- BL – each month, hold big-capitalization stocks with low values of the factor beta.
- SH – each month, hold small-capitalization stocks with high values of the factor beta.
- SL – each month, hold small-capitalization stocks with low values of the factor beta.
- CAPM – each month, hold the one of BH, BL, SH or SL with the highest predicted return based on market betas over the past five years.
- 3-Factor – each month, hold the one of BH, BL, SH or SL with the highest predicted return based on 3-factor betas over the past five years.
- 5-Factor – each month, hold the one of BH, BL, SH or SL with the highest predicted return based on 5-factor betas over the past five years.
- 7-Factor – each month, hold the one of BH, BL, SH or SL with the highest predicted return based on 7-factor betas over the past five years.
Results suggest that:
- The 3-factor model is clearly an improvement over CAPM.
- The 5-factor and 7-factor models are not clearly improvements over the 3-factor model.
- Single-factor smart beta portfolios with the highest expected returns (such as high for profitability) may be as good as or better than multi-factor smart beta portfolios.

In summary, evidence indicates that investors seeking multi-factor smart beta investments may want to keep it simple by considering only market, size and book-to-market factors.
Cautions regarding findings include:
- Results are gross, not net. Accounting for monthly portfolio reformation/switching and shorting costs would reduce reported returns. Moreover:
- Shorting may be infeasible for some stocks as specified due to lack of shares to borrow.
- Costs may vary by portfolio (for example, higher for small stocks) such that net ranking of strategies/portfolios may differ from gross ranking.
- Regressions assume linear relationships between factors and portfolio returns. Relationships may not be linear.
- Trading strategies are beyond the reach of most investors, who would bear fees for delegating to a fund manager.