Is there an exploitable interaction between a stock’s market capitalization and its price? In their February 2015 paper entitled “Nominal Prices Matter”, Vijay Singal and Jitendra Tayal examine the relationship between stock prices and returns after: (1) controlling for market capitalization (size); (2) isolating the month of January; and, (3) excluding very small stocks. They each year perform double-sorts based on end-of-November data first into ranked tenths (deciles) by size and then within each size decile into price deciles. They calculate returns for January and for the calendar year with and without January. Using monthly prices and end-of-November market capitalizations for the 3,000 largest U.S. common stocks during December 1962 through December 2013, quarterly institutional ownership data for each stock during December 1980 through December 2013, and actual number of shareholders for each stock during 2004 through 2012, they find that:
- Controlling for size and using equally weighted portfolios over the entire sample period (see the chart below):
- Very low-priced stocks outperform very high-priced stocks during January by an average 5.2%, with outperformance strongest (9.7%) for the smallest size decile and weakest (2.1%) for the largest size decile. This average outperformance translates to a four-factor (market, size, book-to-market, momentum) alpha of 1.9%.
- However, during February through December, very high-priced stocks outperform very low-priced stocks by an annual average 5.8%, somewhat (but inconsistently) more so among small than large size deciles. This average outperformance translates to a monthly four-factor alpha of 0.56% (0.95% among low size deciles).
- Over the entire calendar year, these effects offset such that there is no significant difference in returns between very high-priced stocks and very low-priced stocks, but high-priced stocks still outperform based on four-factor alpha (0.36% per month).
- Outperformance of high-priced stocks during February through December is stronger after excluding the smallest stocks or stocks priced below $5.
- The number of shareholders is nearly four times higher for low-price stocks than high-priced stocks, suggesting that individual investors prefer low-priced stocks and that high demand for these stocks results in overvaluation. Also, low-priced stocks tend to exhibit relatively high idiosyncratic volatility and therefore relatively low returns.
- On average, stocks that split generate returns during months 12-24 after the split that are about a third lower than those for months 24-12 before the split, offering additional evidence that high-priced stocks tend to outperform low-priced stocks.
- A two-part hedge strategy that each year over the past 51 years is (1) long (short) very low-priced (high-priced) stocks during January and (2) long (short) very high-priced (low-priced) stocks during February through December generates an average gross annual return of 5.63%. Excluding stocks with prices below $5 increases this return to 6.28%.
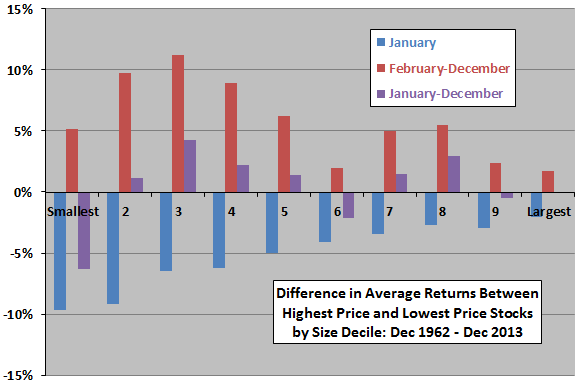
The following chart, constructed from data in the paper, summarizes average returns for equally weighted hedge portfolios that are long (short) the tenth of stocks with the highest (lowest) prices within each size decile. Since the universe is 3,000 stocks, each side of each hedge portfolio consists of 30 stocks. Results show that, on average:
- During January, very low-priced stocks consistently outperform very high-priced stocks, more so for small stocks than large stocks.
- During February through December, very high-priced stocks consistently outperform very low-priced stocks, somewhat more so for small stocks than large stocks.
- Over the entire calendar year, these two effects largely offset.

In summary, evidence indicates that investors may be able to exploit the underperformance (outperformance) of very high-priced U.S. stocks compared to very low-priced U.S. stocks during January (February-December).
Cautions regarding findings include:
- The number of stocks (30) in size-price double-sorts is not large, such that extreme performers may drive results some of the time.
- Returns reported for the hedge portfolio are gross, not net. Accounting for trading frictions associated with annual portfolio reformation would reduce these returns. Accounting for shorting costs would also reduce returns, and shorting may not be feasible for some stocks. Portfolio formation rules may select stocks that are relatively costly to trade and have high shorting costs/constraints.