Are Initial Coin Offerings (ICO), also called token sales or token offerings, typically good investments? ICOs are smart contracts on a blockchain (usually Ethereum) that enable firms to raise money directly from investors. The median time for listing a successful ICO on a token exchange is 42 days. In the May 2019 revision of his paper entitled “The Pricing and Performance of Cryptocurrency”, Paul Momtaz examines the performance of ICOs for horizons of one day to three years after initial listing. He also investigates whether there are robust predictors of initial pricing and longer term performance. His sample consists of all tokens tracked by coinmarketcap.com during January 2013 through April 2018, less confirmed errors and outliers in extreme 1% tails because they are unverifiable. His benchmark for calculating abnormal returns is the market capitalization-weighted return of cryptocurrencies (dominated by Bitcoin and Ethereum). Using daily high, low and closing prices, market capitalizations and trading volumes of 1,403 ICOs and daily closes of major cryptocurrencies during the specified period, he finds that:
- The average (median) firm reports gross ICO proceeds $37.8 million ($0.15 million).
- There is a also pronounced positive skewness in the distribution of ICO gross returns. For example:
- Average (median) first-day raw gross return is 14.8% (1.5%). 40% of ICOs have negative first-day returns.
- Average (median) raw gross return is strongly positive (moderately negative) at all horizons of one week to three years, except the median at three years is modestly positive. Specifically, average (median) raw gross returns after one month, one year, two years and three years are 25% (-28%), 207% (-37%), 829% (-30%) and 1600% (11%), respectively. 65% of ICOs have negative gross returns after one month.
- First-day abnormal gross returns are similar to raw gross returns, but average abnormal gross returns are negative for all horizons longer than one week because dominant cryptocurrencies (Bitcoin and Ethereum) strongly outperform ICOs.
- ICO return annualized volatility is in the range 19%-27% for horizons up to six months, but escalates to 40%-60% for horizons of a year or longer.
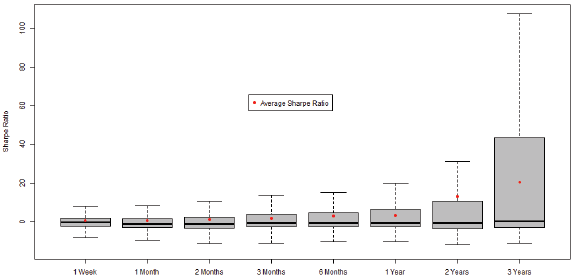
- Average gross Sharpe ratios are impressive for horizons of one, two or three years at 3.16, 13.02, and 20.57, respectively. As for returns, however, median Sharpe ratios are negative or unimpressive (see the chart below).
- Liquidity (trading volume), market capitalization and high-low price ratios relate positively, negatively and positively to first-day ICO returns, respectively.
- For long horizons, similar liquidity and size effects are evident.
The following chart, taken from the paper, summarizes distributions of ICO gross Sharpe ratios across investment horizons. Gray boxes indicate the second and third fourths (quartiles) of the distribution. Dashed whiskers indicate the bottom and top quartiles. Red dots indicate averages, and black horizontal lines indicate medians.

In summary, evidence indicates that the distribution of ICO returns has strong positive skewness, such that the average performance (attractive) is not typical performance (unattractive). Small ICOs tend to outperform large ones.
Cautions regarding findings include:
- The sample period is short, and the ICO market is immature, so findings may not hold as the market matures.
- Reported returns are gross, not net. ICOs may have high bid-ask spreads on exchanges, materially reducing performance.
- Most investors cannot hold large portfolios of ICOs, thereby exposing them to the typical ICO performance rather than the average performance.