Does global diversification improve smart beta (equity factor) investing strategies? In their September 2017 paper entitled “Diversification Strikes Again: Evidence from Global Equity Factors”, Jay Binstock, Engin Kose and Michele Mazzoleni examine effects of global diversification on equity factor hedge portfolios. They consider five factors:
- High-Minus-low Value (HML) – book equity divided by market capitalization.
- Small-Minus-Big Size (SMB) – market capitalization.
- Winners-Minus-Losers Momentum (WML) – cumulative return from 12 months ago to one month ago.
- Conservative-Minus-Aggressive Investment (CMA) – change in total assets.
- Robust-Minus-Weak Operating Profitability (RMW) – total sales minus cost of goods sold, selling, general, and administrative expenses and interest, divided by total assets.
They reform each factor portfolio annually at the end of June by: (1) resetting market capitalizations, segregating firms into large (top 90%) and small (bottom 10%); (2) separately for large and small firms, constructing high (top 30% of factor values) minus low (bottom 30%) long-short sub-portfolios; and, (3) averaging returns for the two sub-portfolios to generate factor portfolio returns. They lag firm accounting data by at least six months between fiscal year end and portfolio formation date. They define eight global regions: U.S., Japan, Germany, UK, France, Canada, Other Europe and Asia Pacific excluding Japan. When measuring diversification effects, they consider relatedness of country markets and variation over time. Using the specified firm accounting data and monthly stock returns during October 1990 through February 2016, they find that:
- No factor hedge portfolio is significantly successful in all eight regions. In particular:
- Value is weak in the U.S., UK and France.
- Size is uniformly insignificant.
- Momentum is weak in the U.S. and Japan.
- Investment and operating profitability are each significant in only three regions.
- Regional market return correlations generally range between 0.60 and 0.70. Regional factor hedge portfolio returns are also significantly correlated. Specifically, correlations across regions generally range from:
- 0.20 to 0.50 for value.
- 0.40 to 0.60 for momentum.
- 0.20 to 0.40 for size and investment.
- 0.05 to 0.20 for profitability.
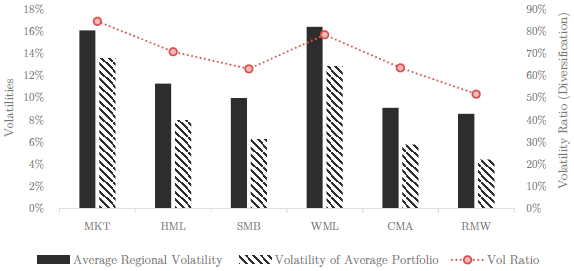
- Diversifying regional factor hedge portfolios across other regions substantially lowers volatility (see the chart below). For example, on average, a U.S. investor realizes a 30% reduction in factor hedge portfolio volatility by diversifying globally.
- Regional stock markets with high return correlations (such as the U.S. and UK) also tend to have high factor hedge portfolio return correlations.
- Unlike those for regional market returns, correlations among regional factor hedge portfolio returns do not increase from October 1990-December 2002 to January 2003-February 2016.
- As for regional market returns, correlations among regional factor hedge portfolio returns tend to rise during equity bear markets (negative average S&P 500 Index monthly return over the past year), such that diversification weakens when most needed.
The following chart, taken from the paper, characterizes volatility reductions from diversifying market portfolios (MKT) and the five equity factor hedge portfolios across regions. For each, black columns represent average (equally weighted) regional portfolio volatilities, while striped bars represent volatilities of global factor portfolios (based on average regional factor hedge portfolio returns) per the left vertical axis. Red dots indicate the ratio of diversified to average portfolio volatilities per the right vertical axis. A ratio of 70%, for example, means a 30% reduction in volatility from diversification. Notable points are:
- Diversification suppresses volatility for all factor hedge portfolios, most strongly for operating profitability and least strongly for momentum.
- Factor hedge portfolio diversification reductions are generally greater than those for market returns.

In summary, evidence indicates that equity factor hedge portfolio diversification across global stock markets may be a valuable volatility suppression strategy.
Cautions regarding findings include:
- Returns are gross, not net. Costs of annual portfolio reformation and continuous shorting would reduce the returns. Shorting as specified is probably not fully feasible due to lack of shares to borrow. These frictions may vary by factor and country.
- As noted in the paper, results also ignore capacity constraints, trading restrictions and tax implications of foreign investments.
- Determination and execution of factor hedge portfolios are beyond the reach of most investors, who would bear administrative and management fees for delegating processes to fund managers.