Does transient factor popularity drive factor/smart beta portfolio performance by pushing valuations of associated stocks up and down? In their February 2016 paper entitled “How Can ‘Smart Beta’ Go Horribly Wrong?”, Robert Arnott, Noah Beck, Vitali Kalesnik and John West examine degrees to which factor hedge portfolio and stock factor tilt (smart beta) backtests are attractive due to:
- Steady and clearly sustainable factor premiums; or,
- Changes in factor relative valuations, measured as average price-to-book value ratio of stocks with high expected returns (factor portfolio long side) divided by average price-to-book ratio of stocks with low expected returns (factor portfolio short side). This ratio tends to increase (decrease) as investor assets move into (out of) factor portfolios.
They consider six long-short factor hedge portfolios: value, momentum, market capitalization (size), illiquidity, low beta and gross profitability. They also consider six smart beta portfolios, which they (mostly) require to sever the relationship between stock price and portfolio weight and to have low turnover, substantial market breadth, liquidity, capacity, transparency, ease of testing and low fees: equal weight, fundamental index, risk efficient, maximum diversification, low volatility and quality. Using specified annual and monthly factor measurement data and returns for a broad sample of U.S. stocks during January 1967 through September 2015, they find that:
- Performances of many factor-based and smart beta strategies interact strongly with changes in corresponding relative valuations, arguably due to strategy popularities (ebb and flow of assets to strategies).
- Over the full sample period, performance appears closely matched to changes in associated relative valuations for four of six factors. Exceptions are momentum and perhaps low beta, which have comparatively high turnovers.
- Current relative valuations suggest that the most popular factors (such as low beta) are expensive (high) compared to their historical norms.
- Similarly, performances of the six smart beta strategies largely track changes in corresponding relative valuations.
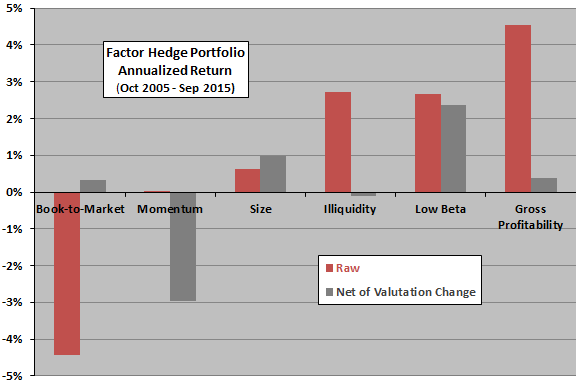
- Over sample periods as short as a decade, factor/smart beta portfolio performances are sensitive to distortions from changes in corresponding relative valuations (see the chart below). Specifically, during October 2005 through September 2015:
- Among the six factor portfolios, gross profitability (value) has the best (worst) raw gross performance. Essentially all the outperformance of gross profitability comes from the increasing ratio of high-profit stock valuations to low-profit stock valuations. In contrast, value stocks grow relatively cheaper.
- Much of the outperformance of momentum and illiquidity comes from rising relative valuations, meaning these factors grow more expensive over the decade.
- The six smart beta strategies all beat the market on a raw gross basis. Effects of changing relative valuations are mixed, with decreasing relative valuations hurting risk efficient and fundamental index portfolios (which become cheaper) and helping low volatility, maximum diversification and quality portfolios (which become more expensive).
- Even over the full January 1967 through September 2015 sample period, much or all of the returns for several factors/smart betas (low beta, gross profitability, low volatility, maximum diversification and quality) come from increasing relative valuations. This kind of outperformance is arguably not sustainable.
The following chart, constructed from data in the paper, summarizes gross annualized returns and gross annualized returns after accounting for relative valuation changes for six factor hedge portfolios during a recent decade. Notable points are:
- Value performs poorly because of declining relative valuation of value versus growth stocks.
- Momentum is weak despite a strong tailwind from a rising relative valuation of winner versus loser stocks.
- All the strong performance of illiquidity comes from a rising relative valuation of illiquid versus liquid stocks.
- Low beta performs well while maintaining a stable relative valuation of low beta versus high beta stocks.
- Nearly all the strong performance of gross profitability comes from a rising relative valuation of high profit versus low profit stocks.

In summary, evidence suggests that performance-chasing investors often drive variation in factor/smart beta portfolio returns by injecting or withdrawing assets, thereby setting up reversion-to-mean scenarios.
Cautions regarding findings include:
- Reported returns are gross, not net. Accounting for portfolio rebalancing frictions and shorting costs as applicable would reduce returns. Shorting may not be fully feasible as specified due to lack of shares to borrow. Costs may differ by factor, such that gross and net performance rankings may differ.
- Calculations of factor/smart beta relative valuations is beyond the reach of most investors, who would bear fees for delegating the calculations to an advisor.