The many factor-based indexes and exchange-traded funds (ETFs) that track them now available enable investors to construct multi-factor portfolios piecemeal. Is such piecemeal construction suboptimal? In their July 2018 paper entitled “The Characteristics of Factor Investing”, David Blitz and Milan Vidojevic apply a multi-factor expected return linear regression model to explore behaviors of long-only factor portfolios. They consider six factors: value-weighted market, size, book-to-market ratio, momentum, operating profitability and investment(change in assets). Their model generates expected returns for each stock each month, and further aggregates individual stock expectations into factor-portfolio expectations holding all other factors constant. They use the model to assess performance differences between a group of long-only single-factor portfolios and an integrated multi-factor portfolio of stocks based on combined rankings across factors. The focus on gross monthly excess (relative to the 10-year U.S. Treasury note yield) returns as a performance metric. Using data for a broad sample of U.S. common stocks among the top 80% of NYSE market capitalizations and priced at least $1 during June 1963 through December 2017, they find that:
- The model generates a statistically significant expected average gross monthly excess return for each factor over the sample period, and predicted averages align well with actual averages.
- Long-only portfolios based on gross expected excess returns for a single factor are suboptimal, because some selected stocks are unattractive with respect to other factors. For example, on average, about 20% of stocks in a pure value portfolio are expected to underperform the market based on all factors.
- Excluding from single-factor portfolios those stocks expected to underperform the market improves performance. For value, momentum and investment single-factor portfolios, such exclusions boost average gross monthly return by about 20%. For size, the increase is about 50%. For profitability, the increase is over 200% (0.08% to 0.29% per month).
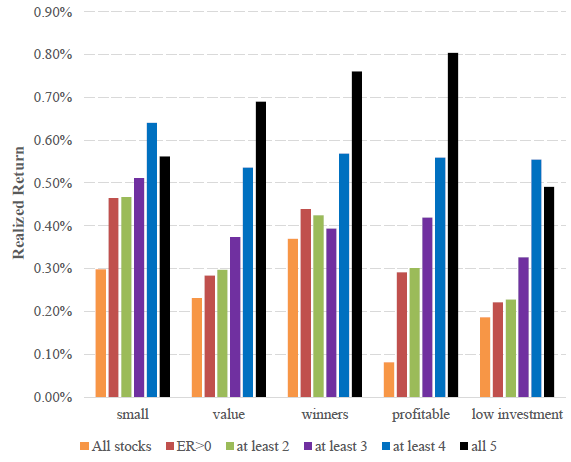
- Further requiring that all stocks in single-factor portfolios have non-negative exposures to at least one, two, three or all four other non-market factors incrementally boosts performance (see the chart below). For example, the pure value portfolio has actual average gross monthly return:
- 0.23% with no exclusions (average 302 stocks per month).
- 0.28% by retaining only stocks expected to match or beat the market (average 276 stocks remaining).
- 0.30% by also retaining only stocks that have non-negative exposures to at least one other non-market factor (average 273 stocks remaining).
- 0.37% by also retaining only stocks that have non-negative exposures to at least two other non-market factors (average 223 stocks remaining).
- 0.54% by also retaining only stocks that have non negative exposures to at least three other non-market factors (average 96 stocks remaining).
- 0.69% by also retaining only stocks that have non-negative exposures to all five non-market factors (average just 13 stocks remaining).
- A mix of such enhanced single-factor portfolios matches the performance of an integrated multi-factor portfolio when constructed with similar factor exposures.
- On average, 9.8% of stocks in the market portfolio have negative expected excess returns. Excluding such stocks boosts average excess monthly return from 0.36% to 0.42%.
The following chart, taken from the paper, compares actual average gross monthly excess returns for each of the five non-market long-only single-factor portfolios as follows:
- Base portfolio with no exclusions (All stocks, orange).
- Retaining only stocks expected to match or beat the market (ER>0, red).
- Also retaining only stocks that have non-negative exposures to at least one other non-market factor (at least 2, green).
- Also retaining only stocks that have non-negative exposures to at least two other non-market factors (at least 3, purple).
- Also retaining only stocks that have non negative exposures to at least three other non-market factors (at least 4, blue).
- Also retaining only stocks that have non-negative exposures to all five non-market factors (all 5, black).
Results show that this approach generally, but not perfectly, boosts the performance of single-factor stock portfolios.

In summary, evidence indicates that investors can boost the gross performance of single-factor exposures by excluding stocks with negative expected returns for other factors.
Cautions regarding findings include:
- All results are gross, not net. Accounting for portfolio turnover frictions would reduce returns. Frictions may vary by factor and by portfolio exclusion conditions, such that net findings could differ from gross findings.
- Average monthly return is not sufficient as a portfolio performance metric to assess overall strategy attractiveness. Some portfolios may be highly volatile and/or crash-prone.
- Data collection/processing as described is beyond the reach of most investors, who would bear fees for delegating to a fund manager.