In their July 2019 paper entitled “Momentum-Managed Equity Factors”, Volker Flögel, Christian Schlag and Claudia Zunft test exploitation of positive first-order autocorrelation (time series, absolute or intrinsic momentum) in monthly excess returns of seven equity factor portfolios:
- Market (MKT).
- Size – small minus big market capitalizations (SMB).
- Value – high minus low book-to-market ratios (HML).
- Momentum – winners minus losers (WML)
- Investment – conservative minus aggressive (CMA).
- Operating profitability – robust minus weak (RMW).
- Volatility – stable minus volatile (SMV).
For factors 2-7, monthly returns derive from portfolios that are long (short) the value-weighted fifth of stocks with the highest (lowest) expected returns. In general, factor momentum timing means each month scaling investment in a factor from 0 to 1 according its how high its last-month excess return is relative to an inception-to-date window of past levels. They consider also two variations that smooth the simple timing signal to suppress the incremental trading that it drives. In assessing costs of this incremental trading, they assume (based on other papers) that realistic one-way trading frictions are in the range 0.1% to 0.5%. Using monthly data for a broad sample of U.S. common stocks during July 1963 through November 2014, they find that:
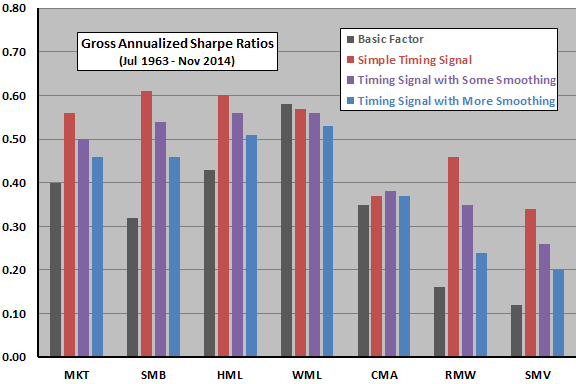
- Momentum timing produces material gains in annualized gross average excess returns and Sharpe ratios for five of seven factor portfolios (not WML or CMA). While suppressing incremental trading, progressively smoothing the timing signal generally reduces gains (see the first chart below). Specifically, for simple momentum timing over the full sample period:
- Annualized boosts in average gross excess returns for MKT, SMB, HML, RMW and SMV are 2.41%, 5.57%, 2.23%, 4.33% and 5.52%, respectively.
- Respective boosts in annualized gross Sharpe ratios are 0.40 to 0.55, 0.32 to 0.61, 0.43 to 0.60, 0.16 to 0.46 and 0.12 to 0.33.
- However, momentum timing drives considerable incremental trading.
- Simple momentum timing increases average monthly one-way turnovers of MKT, SMB, HML, WML, CMA, RMW and SMV from 0.8% to 33.0%, 12.7% to 54.4%, 9.8% to 51.8%, 68.6% to 77.8%, 17.9% to 52.9%, 7.4% to 51.0% and 8.5% to 46.6%, respectively. While sacrificing performance boosts, smoothed timing signal suppress these increases in trading.
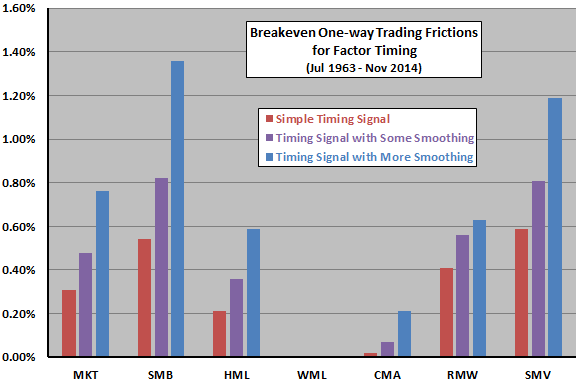
- Performance boosts from simple momentum timing survive as long as trading frictions do not exceed levels ranging from 0.21% (HML) to 0.59% (SMV). These breakeven frictions are generally higher for smoothed signals (see the second chart below).
- Gross performance boosts from momentum timing carry over to multi-factor portfolios formed via either mean-variance optimization or equal basic weighting.
- Findings largely hold in subsamples, during recessions, in many other developed markets and for different factor and timing specifications.
- Momentum timing boosts are similar in magnitude to those from factor volatility timing and factor valuation timing, and are substantially independent of those other strategies.
The following chart, constructed from findings in the paper, summarizes gross annualized Sharpe ratios for each of the seven basic factors and for each of the three momentum timing signals for each factor. The purpose of timing signal smoothing is to suppress incremental trading generated by timing signals. Notable points are:
- Short-term momentum signals mostly boost gross factor portfolio performances, but not for WML (momentum factor) and CMA (investment factor).
- Smoothing of these signals generally weakens gross timing strategy effects.

The next chart, also constructed from findings in the paper, summarizes breakeven one-way trading frictions for the incremental trading introduced by applying each of the three short-term momentum timing signals to each of seven basic factor portfolios. Notable points are:
- Five of 21 combinations clearly survive incremental trading frictions of 0.5%.
- The greater level of signal smoothing works best on a net basis.

In summary, evidence indicates that some investors may be able to exploit short-term factor momentum to boost performance of associated factor portfolios.
Cautions regarding findings include:
- Data are nearly five years stale.
- Trading frictions over much of the sample period may be higher than assumed by the authors (see “Trading Frictions Over the Long Run”). Moreover, the biggest changes in timing signals may occur during times of market stress when trading frictions are exceptionally high.
- Approaches considered are beyond the reach of most investors, who would bear fees for delegating to a fund manager.
- Testing multiple factors and timing signals on the same sample introduces data snooping bias, such that the best-performing combinations overstate expectations.
See also “Ubiquitous Equity Factor Momentum?” and “Stock Factor/Anomaly Momentum”.