Does stock performance vary with age (since listing), and does any such effect interact with market capitalization (size)? In their April 2019 paper entitled “Age Matters”, Danqiao Guo, Phelim Boyle, Chengguo Weng and Tony Wirjanto examine age and size of U.S. stocks in combination. To disentangle interaction, they generate 20,000 simulations for each of two sets of portfolios separately for holdings of 5, 25, 50 or 100 stocks:
- Rebalanced – a randomly selected equal-weighted portfolio rebalanced each month to equal weight after replacing delisted stocks (roughly 10% of stocks each year) with replacements randomly selected from those in the full sample not already in the portfolio. New stocks are representative of the market in terms of age, while residual stocks age by a month, such that the portfolio tends to grow older.
- Bootstrapped – a randomly selected equal-weighted (also, for reference, value-weighted) portfolio that is each month liquidated and randomly reformed, such that it remains representative of the full sample in terms of age.
If stock return is related to age, these two sets of portfolios perform differently. They further compare performances of 16 portfolios double-sorted into four age groups (quartiles) and four size quartiles. Using monthly returns and listing dates for a broad sample of U.S. stocks during July 1926 through December 2016, they find that:
- Across portfolio sizes, rebalanced equal-weighted portfolios beat corresponding bootstrapped equal-weighted portfolios by an annualized average gross 0.49% (100 stocks) to 1.23% (5 stocks).
- Per a conventional size effect, equal-weighted bootstrapped portfolios beat value-weighted bootstrapped portfolios by an annualized average gross 2.24%.
- Rebalanced beats bootstrapped consistently after 1976, when steady-state average age difference between rebalanced and bootstrapped portfolios is about a dozen years. For example, for 100-stock portfolios, rebalanced minus bootstrapped annualized average gross returns are:
- -0.01% during July 1926 through December 1976.
- 2.32% during January 1977 through December 2016.
- 1.49% during January 2007 through December 2016.
- Within the younger half of stocks, there is a significantly positive relationship between age and return. However, the age-return relationship in the second oldest (oldest) age quartile is insignificant (significant and negative). In other words, old stocks typically exhibit a decline in returns. These age effects are evident across size quartiles.
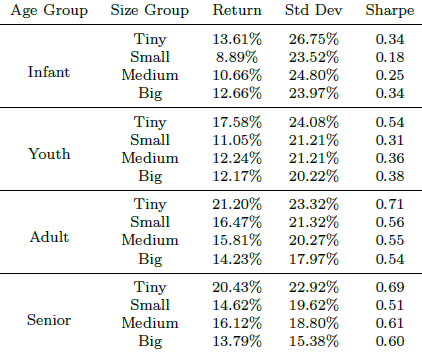
- Up through 1976, the size effect dominates the age effect. After 1976, the age effect dominates the size effect, with stocks that are both mature and small tending to perform best (see the table below).
The following table, taken from the paper, summarizes annualized gross returns, volatilities and Sharpe ratios for 16 groups of equal-weighted portfolios formed by double sorting into age and size quartiles at the beginning of each month starting January 1977 and held through December 2016. Findings confirm both age and size effects, most dramatically for Sharpe ratios. Best performances are for Tiny (first size quartile) stocks that are above average in age (Adult and Senior).

In summary, evidence indicates that investors may be able to boost the size effect by focusing on stocks with the longest histories.
Cautions regarding findings include:
- Returns are gross, not net. However, maintaining bootstrapped portfolios would be far more costly than maintaining rebalanced portfolios.
- Randomly selected portfolios may contain stocks that are illiquid, lacking capacities for large portfolios. Tiny stocks in the table above may be illiquid.
- Testing many portfolio combinations on the same sample introduces data snooping bias, such that the best-performing combination overstates expectations.
- Lack of consistency between data before and after the end of 1976 undermines confidence in findings.