“Is There Really an Size Effect?” summarizes research challenging the materiality of the equity size effect. Is there a counter? In their June 2018 paper entitled “It Has Been Very Easy to Beat the S&P500 in 2000-2018. Several Examples”, Pablo Fernandez and Pablo Acin double down on the size effect via a combination of market capitalization thresholds and equal weighting. Specifically, they compare values of a $100 initial investment at the beginning of January 2000, held through April 2018, in:
- The market capitalization-weighted (MW) S&P 500.
- The equally weighted (EW) 20, 40, 60 and 80 of the smallest stocks in the S&P 1500, reformed either every 12 months or every 24 months.
All portfolios are dividend-reinvested. Their objective is to provide investors with facts to aid portfolio analysis and selection of investment criteria. Using returns for the specified stocks over the selected sample period, they find that:
- The four EW portfolios, whether reformed annually or biennially:
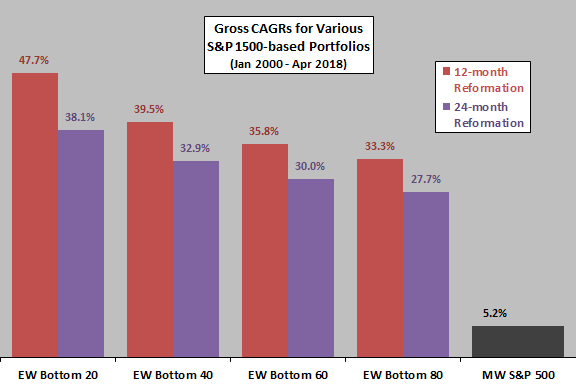
- Easily outperform MW S&P 500 based on compound annual growth rate (CAGR) over the selected sample period (see the chart below).
- Uniformly beat MW S&P 500 every year during 2000-2017.
- Results for the broad U.S. stock market since 1927 are qualitatively similar.
- Results are qualitatively similar for the smaller Spanish stock market during January 2000 through March 2018.
- Long-term investors should focus on CAGR and ignore the lure of strategies emphasizing low volatilities and high Sharpe ratios.
The following chart, constructed from data in the paper, summarizes gross CAGRs for the four EW smaller-stock portfolios, reformed either annually or biennially, and for MW S&P 500 over the specified sample period. Results show that the small EW portfolios easily beat broad market based on gross CAGR.

In summary, evidence suggests that an equally weighted portfolio of relatively small stocks, rebalanced annually or biennially, generates an attractive long-term gain.
Cautions regarding findings include:
- Reported results are gross, not net. Accounting for annual/biennial portfolio reformation frictions and dividend reinvestment frictions would reduce growth rates. These frictions vary considerably over long sample periods.
- Dividends incur taxes, and portfolio reformations trigger capital gains taxes, also reducing reported growth rates.
- The small EW portfolios are likely much more volatile than the MW S&P 500 portfolio (not quantified in the paper). Some investors prefer risk-adjusted performance metrics, such as Sharpe ratio, over simple CAGR.