What calendar and technical factors drive the size effect? In the June 2012 version of his paper entitled “Predictable Dynamics in the Small Stock Premium”, Valeriy Zakamulin explores the interaction of the size effect with the January effect and both prior-month and prior-year stock market returns. He defines the size effect based on the Small-Minus-Big (SMB) factor of the Fama-French three-factor model of stock returns. A positive (negative) value for the effect means that small (big) stocks outperform big (small) stocks. Using market factor and SMB factor returns from the library of Kenneth French and National Bureau of Economic Research (NBER) business cycle dates during 1927 through 2011 (85 years), he finds that:
- Over the entire sample period, the average monthly gross size effect is 0.25%, with the average in January 2.32% and the average across other months 0.06%.
- The average monthly gross size effect during months after market up (down) months is 0.69% (-0.45%), with the average in January 3.01% (2.10%) and the average across other months 0.53% (-0.64%).
- The average monthly gross size effect during months when the prior-year market return is positive (negative) is 0.08% (0.77%), with the average in January 1.83% (3.77%) and the average for other months -0.08% (0.49%).
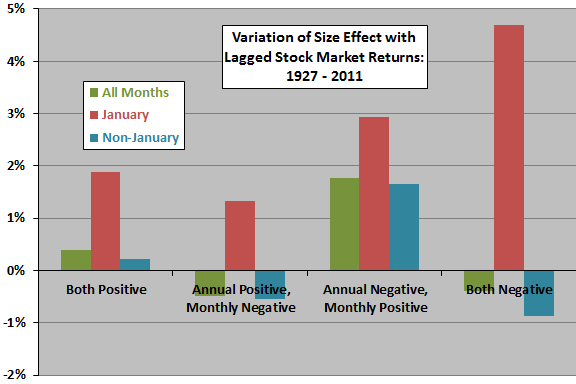
- The size effect is strongest during months when the prior-year return is negative and the prior-month return is positive, with average monthly gross size effects of 1.76%, 2.93% and 1.66% for all months, January and non-January months, respectively (see the charts below).
- In general, small stocks react quickly to bad news, but with a delay to good news. During economic expansions (contractions) lasting at least a year, the delayed reaction to good news is weak (strong), such that the size effect is absent or negative (positive) during non-January months.
- The January effect accounts for about a quarter of the size affect.
The following chart, constructed from data in the paper, summarizes variation of the size effect with prior-year and prior-month stock market returns for all months, January and non-January months over the entire sample period. Results indicate that the size effect is significant across non-January calendar months only when the prior-year return is negative and the prior-month return is positive. The size effect is strong in January under all lagged market return conditions, and exceptionally strong when prior-year and prior-month market returns are both negative.

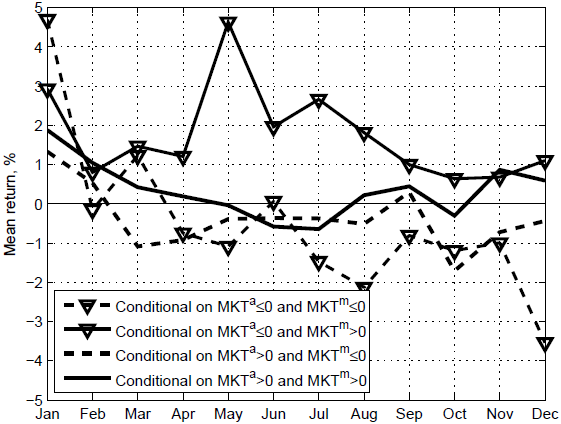
The next chart, taken from the paper, provides detail by calendar months for the averages in the preceding chart, with MKTa and MKTm defined as prior-year and prior-month market returns, respectively.

In summary, evidence suggests that delayed and strong reaction of small stocks to good news during prolonged economic weakness, in combination with the January effect, drives the size effect.
Cautions regarding findings include:
- Reported returns are gross, not net. Including reasonable trading frictions, which tend to be higher among small stocks than big stocks, may affect exploitability.
- While linkage to an economic/behavioral explanation mitigates, testing multiple rules on the same data introduces data snooping bias, such that results for the best-performing combination include luck that will not persist out of sample.
- NBER identifies economic expansions and contractions only retrospectively with considerable delay.
- Analysis assumes that return distributions are tame. To the extent that they are wild, statistical significance tests break down.
See also the closely related “Predicting Variation in the Size Effect” and “When and Why of the Size Effect” by the same author.