Do unconventional portfolio construction techniques obscure how, and how well, betting against beta (BAB) works? In their November 2018 paper entitled “Betting Against Betting Against Beta”, Robert Novy-Marx and Mihail Velikov revisit the BAB factor, focusing on interpretation of three unconventional BAB construction techniques:
- Rank weighting of stocks – BAB employs rank weighting rather than equal or value weighting, with each stock in high and low estimated beta portfolios weighted proportionally to the difference between its estimated beta rank and the median rank.
- Hedging by leveraging – BAB seeks market neutrality by deleveraging (leveraging) the high (low) beta portfolio based on estimated betas rather than borrowing to buy the market portfolio to offset BAB’s short market tilt.
- Novel beta estimation – BAB measures stock betas by combining market correlations based on five years of overlapping 3-day returns with volatilities based on one year of daily returns, rather than using slope coefficients of daily stock returns versus daily market returns.
Based on mathematical analysis and empirical results using returns for a broad sample of U.S. stocks during January 1968 through December 2017, they find that:
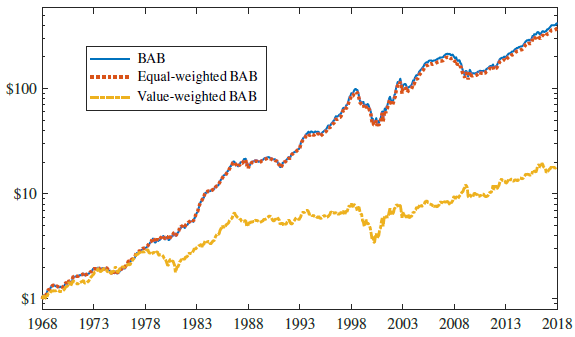
- Rank weighting tilts BAB toward stocks with extreme betas, resulting in portfolios very much like equal weighting. The performance of a more investable value-weighted version of BAB is much less impressive than the published version (see the chart below). Specifically, value-weighted BAB:
- Generates average monthly gross excess return 0.56%, with annualized gross Sharpe ratio 0.49 (compared to 1.08 for rank weighting).
- Derives its performance from strong tilts toward profitability (robust minus weak) and investment (conservative minus aggressive) factors.
- Generates a statistically insignificant 0.24% gross monthly 5-factor (market, size, book-to-market, profitability, investment) alpha.
- Hedging with leverage rather than the market portfolio is a back door to hedging with an equal-weighted portfolio, as rank weighting is a back door to equal weighting. Hedging BAB instead with the value-weighted market portfolio produces gross annualized Sharpe ratio 0.80, compared to 1.08 for hedging with leverage (and 1.26 for hedging with the equal-weighted market portfolio).
- Rank weighting and hedging with leverage result in strong overweighting of the smallest stocks, which have limited capacity and are expensive to trade. Specifically:
- Average annual BAB turnover is 215% (133% from the long side and 82% from the short side).
- Nearly two thirds of this trading is in the smallest NYSE size decile.
- This turnover translates to 0.60% average monthly trading frictions over the full sample period, reducing BAB profitability more than 55%.
- Average monthly net BAB return is 0.48%, with net monthly 5-factor alpha 0.16%.
- Market volatility substantially biases BAB beta estimates. For example, by definition, beta of the value-weighted market is one. However, average BAB beta for the value-weighted market is 1.05, with standard deviation 0.09, and market volatility explains 47% of its time series variation.
The following chart, taken from the paper, compares gross performances of three versions of BAB over the full sample period:
- BAB – as published, based on rank-weighted portfolios of stocks in top and bottom thirds of stocks ranked by BAB beta estimates.
- Equal-weighted BAB – same as BAB but equal-weighted rather than rank-weighted.
- Value-weighted BAB – same as BAB but value (market capitalization)-weighted rather than rank-weighted.
BAB and equal-weighted BAB are nearly identical, with 0.996 correlation of monthly returns. Value-weighted performance, reflecting more achievable results, is much less impressive.

In summary, evidence indicates that previously published BAB factor performance is unrealistic, arguing against use of unconventional (hard-to-interpret) portfolio construction techniques.
Cautions regarding findings include:
- The BAB factor as published likely entails material shorting constraints as well as capacity constraints. Costs may be very high for shorting stocks as specified, and there may be no shares to borrow for some.
- All approaches discussed are beyond the reach of most investors, who would bear fees for delegating to a fund manager.
For additional perspective, see results of this search.