Do surprising fluctuations in short interest ratios of stocks indicate new information from short sellers that predicts returns of these stocks? In their November 2020 paper entitled “Surprise in Short Interest”, Matthias Hanauer, Pavel Lesnevski and Esad Smajlbegovic examine standardized unexpected short interest ratio as a stock return predictor. They define this variable as current short interest ratio minus 12-month simple moving average of monthly short interest ratios divided by standard deviation of short interest ratios over the past 12 months, calculated monthly for each stock. Using stock short interest data, associated stock returns and firm accounting data for U.S. publicly listed common stocks, excluding those priced less than $5 or in the bottom 5% of NYSE market capitalizations, as available during March 1980 through December 2013, they find that:
- For a subsample since 1995 with recorded short interest announcement dates, stocks in top (bottom) 30% of surprises in short interest ratios generate an average -0.25% (+0.27%) return over the next 30 days.
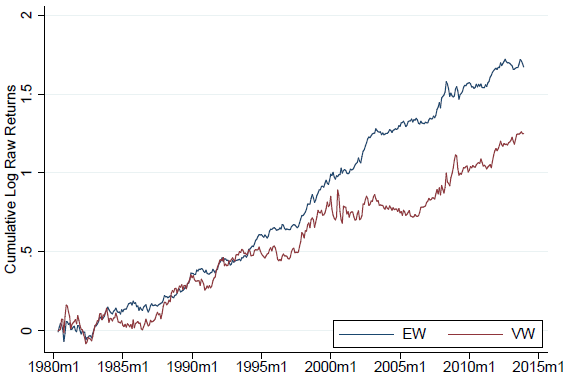
- Over the full sample period, an equal-weighted hedge portfolio that is each month long (short) the 10% of stocks with the lowest (highest) short interest ratio surprises generates 0.43% average gross monthly return. For a value-weighted hedge portfolio, average gross monthly return is 0.35% (see the chart below).
- Hedge portfolio alphas across an array of factor models of stock returns are similar in magnitude to raw returns, indicating that standardized unexpected short interest ratio represents a distinct source of information about future stock returns.
- Hedge portfolio gross profitability is particularly strong around earnings announcements, suggesting that short sellers trade on mispricing due to incorrect beliefs of others about company fundamentals.
- Return predictability is stronger among stocks that are illiquid, volatile and/or have widely dispersed analyst earnings forecasts, but is not related to stock shorting costs.
The following chart, taken from the paper, compares cumulative gross returns for equal-weighted and value-weighted hedge portfolios based on standardized unexpected short interest ratio as specified above during March 1980 through December 2013. Results indicate that the strategy is crash-resistant.

In summary, evidence indicates that unusual changes in stock short interest relative to the prior year relate negatively to future stock returns.
Cautions regarding findings include:
- Data are stale by seven years.
- Reported returns are gross, not net. Accounting for frictions from monthly portfolio reformation and shorting costs would reduce returns. Shorting may not always be feasible as required. Frictions are generally higher for equal-weighted than value-weighted portfolios.
- The methodology is beyond the reach of most investors, who would bear fees for delegating to a fund manager.
- There may be data snooping bias in the selection of a 12-month lookback interval for calculating surprises in short interest, but the paper states that different lookback intervals and other ways of calculating surprises produce qualitatively similar results.
For other research related to short interest, see results of this search.