Do stocks with high borrowing costs reliably underperform? In their October 2020 paper entitled “The Loan Fee Anomaly: A Short Seller’s Best Ideas”, Joseph Engelberg, Richard Evans, Gregory Leonard, Adam Reed and Matthew Ringgenberg examine equity loan fees (stock borrowing costs) as a predictor of stock returns. For perspective, they compare returns of their loan fee anomaly portfolio (short stocks with highest fees and long stocks with lowest fees) to those of 102 other anomalies individually and in aggregate (based on difference for each stock between number of long signals and number of short signals). They consider four long-short anomaly portfolios based on extreme 1%, 2%, 5% and 10% (deciles) of stocks ranked by the metric for each anomaly. They exclude stocks with share price below $5 and those below the 5th percentile of NYSE market capitalization. Using modeled loan fees, monthly total returns for associated stocks and monthly total returns for 102 other anomalies during 2006 through 2019, they find that:
- Loan fees are highly skewed across stocks. The median annual loan fee is 0.36%, but the average is 1.03% and the 99th percentile is 13.7%.
- For the extreme decile portfolio, the loan fee anomaly portfolio has monthly gross return 1.17%, monthly gross Sharpe ratio 0.40 and positive gross returns for 68.3% of months. For the extreme 1% portfolio, average monthly gross return is 3.63%.
- By comparison, average and maximum monthly gross returns for extreme decile (1%) portfolios among the 102 other anomalies are 0.13% and 0.77% (0.24% and 1.87%).
- Short interest as percentage of shares outstanding also performs well as a return predictor, but not as well as loan fee.
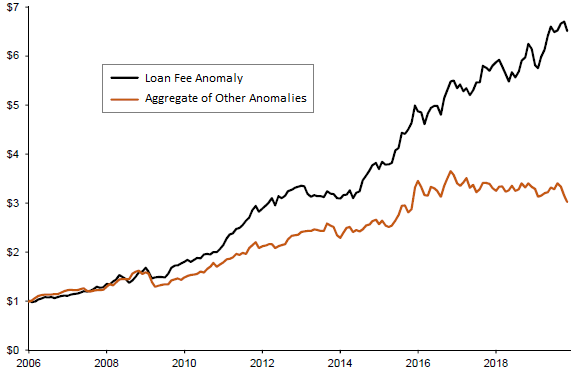
- While most anomalies fade over time, the loan fee anomaly is strong throughout the sample period, persistently outperforming the best other anomalies.
- 28% of the loan fee anomaly derives from exposures to the best other anomalies, and 72% is attributable to unique information of short sellers.
- Outperformance of other anomalies comes almost exclusively from high loan-fee stocks. For example, among stocks with high (low) loan fees, the aggregate signal of other anomalies generates average monthly gross long-short return 1.82% (0.25%).
- After accounting for loan fees in the short leg, the extreme decile loan fee anomaly portfolio generates average monthly return 0.48%, compared to -0.02% for the average of other anomalies.
- Findings generally hold after excluding stocks below the 20th percentile of NYSE market capitalizations.
The following chart, taken from the paper, compares the gross growth of $1 initial investment in each of the extreme decile loan fee anomaly portfolio and the extreme decile aggregate anomaly portfolio over the full sample period. Terminal values are $6.51 and $3.01, respectively, with outperformance of loan fee largely consistent. Accounting for monthly portfolio reformation frictions, data costs and shorting costs would substantially reduce performances of both plots.

In summary, evidence indicates that stock loan fees offer strong and reliable information about future stock returns, with exploitation subject to high costs.
Cautions regarding findings include:
- As noted, most results do not account for monthly portfolio reformation frictions, data costs or shorting costs. Results that account for shorting costs do not account for portfolio reformation frictions or data costs. Heavily shorted stocks may have unusually large bid-ask spreads.
- The methodology is beyond the reach of most investors, who would bear fees for delegating to a fund manager.
See also: