“When to Sell Equity Index Put Options” summarizes research finding that the “insurance” premium from systematically selling equity index out-of-the-money (OTM) put options concentrates during the last few days before expiration. An ancillary finding is that a similar, though weaker and more volatile, pattern holds for selling at-the-month (ATM) put options. To test the general finding, we therefore look at the monthly return pattern for the CBOE S&P 500 PutWrite Index (PUT). PUT sells a sequence of one-month, fully collateralized (cash covered) ATM S&P 500 Index put options and holds these options to expiration (cash settlement). Per the referenced research, PUT gains should noticeably concentrate in the week before monthly option expiration. Using daily levels of PUT during mid-July 1986 through mid-February 2017, we find that:
We first consider weekly PUT returns anchored on equity index option expiration, generally the third Friday of each month.
The following table summarizes PUT gross performance statistics over the entire sample period by option expiration cycle week, starting with the week ending with option expiration (OE). Because of option expiration rules, weeks OE through OE+3 have 367 monthly observations, but week OE+4 has only 128. Reported statistics are:
- Average weekly return.
- Standard deviation (StDev) of weekly returns.
- Minimum weekly return.
- Percentage of weekly returns that are positive (% positive).
- Compound annual growth rates (CAGR) for strategies that invest in PUT only during each of the five specified weeks and are otherwise in cash.
- Maximum drawdown (MaxDD) for the same strategies.
Red (blue) shading indicates the best (worst) performance by week and statistic. Per the referenced research, week OE should be the best. However, though week OE has the highest percentage of positive returns, week OE+2 performs best overall. Only week OE+4 loses money (negative CAGR).
In case weekly data obscures fine points regarding a monthly pattern, we also look at daily PUT returns over a more recent sample period.

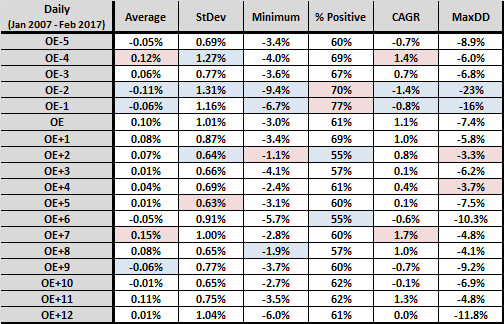
The next table summarizes the same PUT gross performance statistics since 2007 by option expiration cycle day, starting with five trading days before option expiration (OE-5) through 12 trading days after option expiration (OE+12). The number of monthly observations is 121. The number of observations declines for trading days beyond OE+12.
Red (blue) shading indicates the two best (two worst) performances by day and statistic. Per the reference research, days OE-5 through OE-1 should be best. Day OE-4 is among the best, but three of these five days lose money. Days OE-2 and OE-1, despite their high percentages of positive returns, are among the worst days because:
- Day OE-2 has an extreme drawdown streak during September, October and November 2008 (-4.7%, -9.4%, -5.6%).
- Day OE-1 has extreme drawdowns in November 2008, May 2010 and August 2011 (-6.7%, -3.8%, -4.3%).
In other words, crashes more than wipe out the benefit of frequent positive returns. It may be that daily returns during the week before options expirations are relatively volatile and subject to large drawdowns.

In summary, evidence from simple tests generally does not support the referenced research. PUT gains do not noticeably concentrate in the few trading days before monthly option expirations.
Cautions regarding findings include:
- As noted, performance statistics are gross. Accounting for costs of selling put options would reduce performance.
- Results for selling OTM, rather than ATM, put options may be more supportive of the referenced research. (See “Strategy Test”.)
- Results may depend on how many equity market crashes the sample period includes.