How well have long/short equity mutual funds done in recent years? In their April 2019 paper entitled “Hedge Funds Versus Hedged Mutual Funds: An Examination of Long/Short Funds; A Performance Update”, David McCarthy and Brian Wong present an out-of-sample update of a prior performance assessment of long/short equity mutual funds (see “Multialternative Mutual Fund Performance”). They track the same universe as the prior paper and therefore do not include funds launched after January 2013. They construct an equally weighted index of long/short equity mutual funds, rebalanced monthly. They compare performance of this index to those of the S&P 500 Total Return Index, HFRI Equity Hedge Fund Index (HFRI Index) and the Dow Jones Credit Suisse Long/Short Equity Hedge Fund Index (DJ-CS Index). Using monthly returns of 26 live, 14 dead and 4 changed (up to date of change) long/short equity mutual funds established as of January 2013 along with contemporaneous returns for benchmark indexes during July 2013 through December 2018, they find that:
- Over the recent sample period, the long/short equity mutual fund index has equity market exposures (return correlation and beta relative to the S&P 500 Index) similar to those of hedge fund indexes.
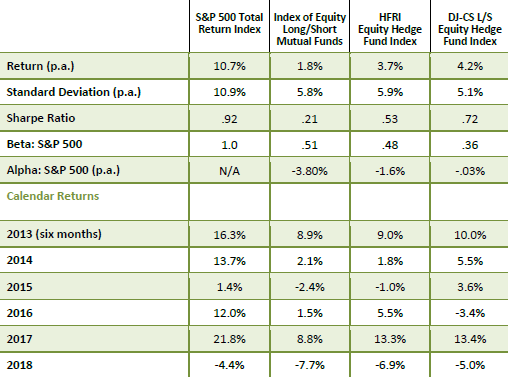
- All mutual fund and hedge fund indexes underperform the S&P 500 Index, and the mutual fund index underperforms the HFRI Index and DJ-CS hedge fund indexes by 1.9% and 2.4% per year, respectively (see the summary table below).
- The overall pattern of annual returns is similar for the mutual fund index and hedge fund indexes, confirming like investment styles and risk levels. However, only in 2014 did the mutual fund index beat the HFRI Index, and only in 2016 did it beat the DJ-CS Index.
- Regarding individual funds during recent years:
- None of the 26 surviving long/short equity mutual funds have positive alpha relative to the S&P 500 Index over recent years.
- The median fund does not have positive alpha for any of years 2014 through 2018.
- The best (worst) surviving fund has an annualized gain (loss) of 7.2% (-7.0%) per year.
- Individual mutual funds do not exhibit performance persistence. A fund in the top half of performance one year is about equally likely to be in the top half or bottom half next year.
- There is a tendency for funds in the bottom half in a given year to close or change strategy the next year.
The following table, taken from the paper, compares annualized average returns, standard deviations of annual returns, annual Sharpe ratio and alpha and beta relative to the S&P 500 Index for the S&P 500 Index, the long/short equity mutual fund index and the two hedge fund indexes over the recent sample period. It also compares calendar year returns for these four indexes. In general, long/short indexes perform poorly compared to the S&P 500 Index.

In summary, recent evidence indicates that the performance of long/short equity mutual funds remains unattractive in absolute terms, risk-adjusted terms and relative to hedge fund indexes.
- As noted in the paper, the available sample period is short and historically strong for the S&P 500 Index.
- Also as noted in the paper, there may be upward performance bias in performance of hedge fund indexes due to cessation of reporting by the worst funds.
- Long/short equity mutual funds introduced in recent years may be superior to older funds.
See also “Are Hedge Fund ETFs Working?”.