“Monthly Rebalanced Shorting of Leveraged ETF Pairs” finds that shorting some pairs of leveraged ETFs may be attractive. How has the strategy worked recently and how sensitive are findings to execution costs? To investigate, we consider three pairs of monthly reset equal short positions in:
- ProShares Ultra S&P500 (SSO) and ProShares UltraShort S&P500 (SDS)
- ProShares UltraPro S&P500 (UPRO) and ProShares UltraPro Short S&P500 (SPXU)
- ProShares UltraPro QQQ (TQQQ) and ProShares UltraPro Short QQQ (SQQQ)
We take initially, and at the end of each month renew, a -$100,000 short position in each pair member. This strategy generates an initial $200,000 cash in the portfolio and subsequently adds to or subtracts from this cash monthly based on short position performance. We initially assume return on cash covers any costs (transaction fees, bid/ask spread and interest on borrowed positions), but then test sensitivity to net carrying cost. Using monthly adjusted closes for these ETFs from respective inceptions through January 2020, we find that:
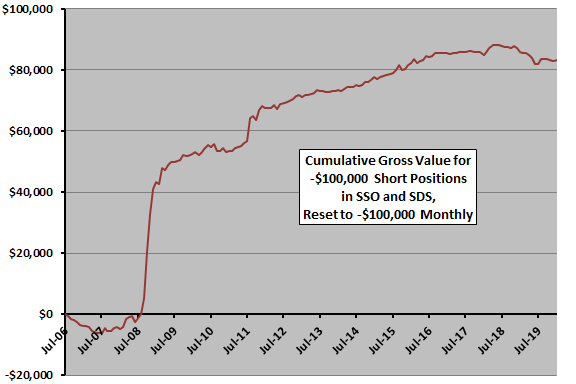
The following chart shows buildup of cash from shorting the SSO/SDS (+2X/-2X) pair as specified over the available sample period. The average gross monthly gain is $514, with standard deviation $1,977 and losses in 38% of months. The deepest monthly loss is -$2,169.
Gains concentrate during times of high volatility in 2008 and 2011. In this regard, average monthly statistics are not meaningful. In other words, the strategy does not generate a steady income, but may be useful as a hedge against equity market crashes.
What happens if the return on cash does not cover carrying costs?
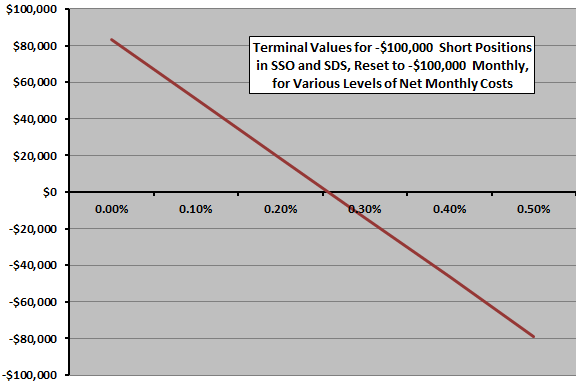
The next chart summarizes sensitivities of terminal net cash for shorting the SSO/SDS pair to monthly net carrying costs ranging from 0.0% to 0.5% (roughly 6.2% annually) of the short balance over the available sample period. The strategy is very sensitive to the level of carrying cost, producing a negative terminal value when monthly carrying costs reach about 0.25%.
What about the UPRO/SPXU pair?
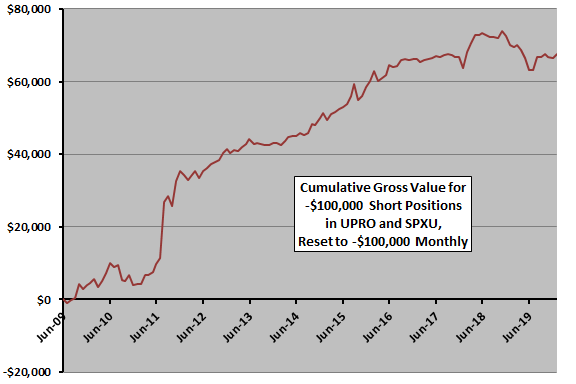
The next chart shows buildup of cash from shorting the UPRO/SPXU (+3X/-3X) pair as specified over the available sample period. The average gross monthly gain is $532, with standard deviation $2,119 and losses in 35% of months. The deepest monthly loss is -$4,275.
Gains concentrate during a time of high volatility in 2011, but are steadier than those for the +2X/-2X pair above. Results in this case are somewhat income-like, but with a drought for the last four years.
What happens if the return on cash does not cover carrying costs?
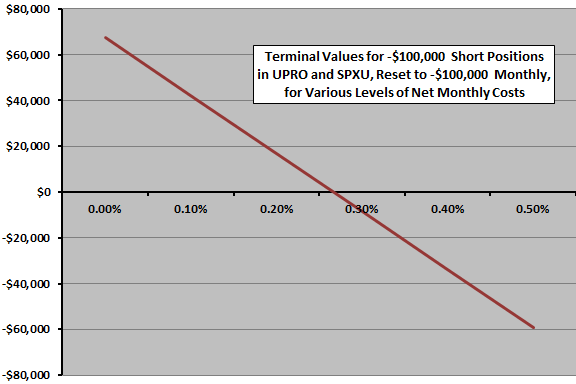
The next chart summarizes sensitivities of net terminal values for shorting the UPRO/SPXU pair to monthly net carrying costs ranging from 0.0% to 0.5% (roughly 6.2% annually) of the short balance over the available sample period. The strategy is very sensitive to the level of carrying cost, with a negative terminal value when monthly carrying costs reach about 0.25%.
What about the TQQQ/SQQQ pair?
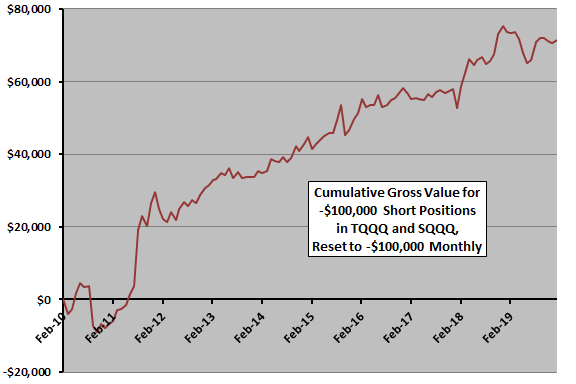
The next chart shows buildup of cash from shorting the TQQQ/SQQQ (+3X/-3X) pair as specified over the available sample period. The average gross monthly gain is $600, with standard deviation $2,883 and losses in 35% of months. The deepest monthly loss is -$11,059.
Gains again concentrate during a time of high volatility in 2011. Results in this case are somewhat income-like, but monthly performance is volatile.
What happens if the return on cash does not cover carrying costs?
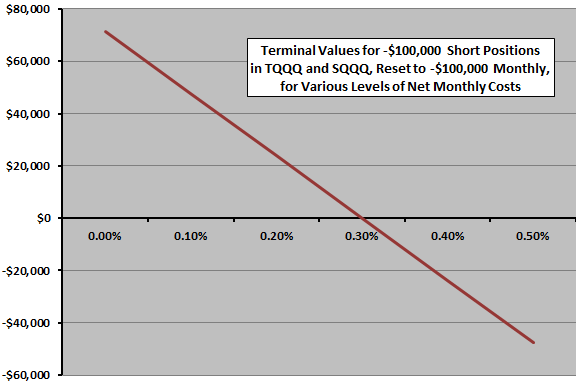
The final chart summarizes sensitivities of net terminal values for shorting the TQQQ/SQQQ pair to monthly net carrying costs ranging from 0.0% to 0.5% (roughly 6.2% annually) of the short balance over the available sample period. The strategy is very sensitive to the level of carrying cost, with a negative terminal value when monthly carrying costs reach about 0.30%.
In summary, evidence from simple tests suggests that shorting pairs of leveraged long/short ETFs is profitable, depending on costs of resetting and carrying short positions, with gains concentrating during bursts of volatility in the underlying.
Return on investment depends on broker capital requirements.
Results suggest that, while the strategy does not consistently generate cash, it may be a cost-effective hedge against equity market crashes.
Cautions regarding findings include:
- The strategy may work better for ETF pairs that are even more volatile than those considered, but pair behaviors can be erratic (see “Multi-year Performance of Leveraged ETFs”).
- Samples are short in terms of number of market volatility bursts.
- Capacities for shorting leveraged ETFs (escalating costs of shorting, or lack of shares to borrow) may limit position sizes, especially during volatility bursts.
See also “Leveraged ETF Pairs Performance”, “Returns of Matched Long and Short Leveraged ETFs” and “Shorting Leveraged ETF Pairs”.