Do individual investors actually trade on their stated beliefs? In their February 2011 paper entitled “Do Investors Put Their Money Where Their Mouth Is? Stock Market Expectations and Trading Behavior”, Christoph Merkle and Martin Weber compare quarterly risk and return expectation survey responses to actual trading data and portfolio holdings for a group of self-directed individual UK investors. Using this investor data, along with contemporaneous measures of actual FTSE All-Share Index returns and volatility during 2008 through 2010 (first survey in September 2008 and last in September 2010), they find that:
- Of 617 total survey respondents (at least 130 per survey iteration), 394 participate multiple times.
- Average (median) trading frequency of respondents is roughly eight (three) trades per quarter. Average (median) quarterly portfolio turnover is 68% (19%). Trading peaks during the financial crisis, with the percentage of buys at that time suggestive of investors seeking to exploit low market valuation.
- Most respondent portfolios are more volatile than the UK market portfolio, apparently driven by idiosyncratic risk due to low diversification (median market beta is only about 0.8).
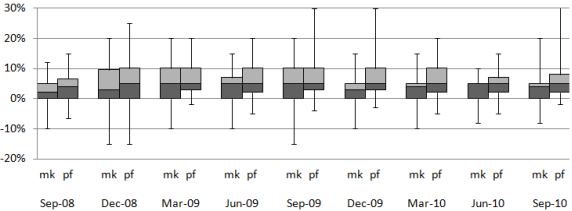
- Respondents tend to be more optimistic about returns for their own portfolios than returns for the market (see chart below), and they tend to underestimate stock market risk. Volatilities implied by their stated return expectation confidence intervals are much lower than option-implied volatility.
- The numeric market return expectation at the time of a survey has little effect on subsequent buy-sell behavior, but survey-to-survey increases in numeric market return expectation relate positively to the buy-sell ratio. Separately, investors viewing prices as qualitatively “cheap” tend to buy stocks.
- Inexplicably, investors who hold negative portfolio return expectations exhibit no greater propensity to sell than other investors. In fact, higher portfolio return expectations make selling more likely. Realized portfolio returns relate positively to selling behavior, in accordance with the disposition effect.
- Consistent with financial theory, actual portfolio risk metrics relate positively (negatively) to numerical market return expectations and risk tolerance (numerical risk expectations, age and and wealth). In other words, portfolio volatilities tend to rise (fall) when return expectations rise (fall). The relationship is weakest for short-term volatility, indicating that investors manage their portfolios based on long-term volatility.
The following chart, taken from the paper, shows boxplots of market (mk) and portfolio (pf) return expectations for all nine survey iterations. Each box with variability range denotes the 5th, 25th, 50th, 75th and 95th percentiles of responses. Return expectations rise during the financial crisis and then revert to the lower pre-crisis level. Investors tend to be more optimistic about their portfolios than about the market, with distributions of portfolio return expectations always at least as high and often higher than market return expectations.

In summary, evidence from belief surveys and associated trading records indicates that it is hard to predict immediate trading activity from stated investor expectations due to confounding factors such as the disposition effect, price-anchoring and liquidity needs. Higher return (risk) expectations do lead to elevated (reduced) risk taking.
Findings appear to undermine general belief that investor sentiment is a reliable short-term stock return predictor.