Do “bubble” stocks (those with high shorting demand and small borrowing supply) exhibit unconventional momentum behaviors? In their December 2018 paper entitled “Overconfidence, Information Diffusion, and Mispricing Persistence”, Kent Daniel, Alexander Klos and Simon Rottke examine how momentum effects for bubble stocks differ from conventional momentum effects. They each month sort stocks into groups independently as follows:
- Momentum winners (losers) are the 30% of stocks with the highest (lowest) returns from one year ago to one month ago, incorporating a skip-month.
- Stocks with high (low) shorting demand are those with the top (bottom) 30% of short interest ratios.
- Stocks with small (large) borrowing supply are those with the top (bottom) 30% of institutional ownerships.
They then use intersections of these groups to reform 27 value-weighted portfolios. Bubble (constrained) stocks are those in the intersection of high shorting demand and low institutional ownership, including both momentum winners and losers. For purity, they further split bubble losers into those that were or were not also bubble winners within the past five years. Using monthly and daily returns, market capitalizations and trading volumes for a broad sample of U.S. common stocks, monthly short interest ratios and quarterly institutional ownership data from SEC Form 13F filings during July 1988 through June 2018, they find that:
- On average, there are 51 bubble winners and 48 bubble losers that are not also bubble winners in the past five years. Average book-to-market ratio for the former (latter) is 0.27 (0.89).
- Average short interest ratio among bubble stocks is 6.52%, and average institutional ownership is 16.1%. Borrowing fees for bubble stocks are high, typically due to large increases over the past 12 months.
- Average next-month gross excess return is -0.47% (-1.54%) for bubble winners (losers).
- Average monthly gross excess return is -0.25% (-0.55%) for bubble winners (losers that are not also past winners) during the first year after portfolio formation. Corresponding 4-factor model (controlling for market, size, book-to-market, momentum factors) alphas are -1.28% and -1.30%, respectively.
- After one year, the momentum effect flips for bubble stocks. Average monthly gross excess return is 0.07% (1.01%) for bubble winners (losers that are not also past winners) during years 2-5 after portfolio formation. Corresponding 4-factor model alphas are -0.75% and 0.23%, respectively (see the chart below).
- Bubble winners and losers selected during the past 12 months tend to drop considerably during the five days after earnings announcements and continue to underperform. Bubble winners selected even longer ago than a year exhibit weakness after earnings announcements.
- Bubble firms tend to be the highest net issuers of stock, consistent with the idea that management views their stocks as overvalued.
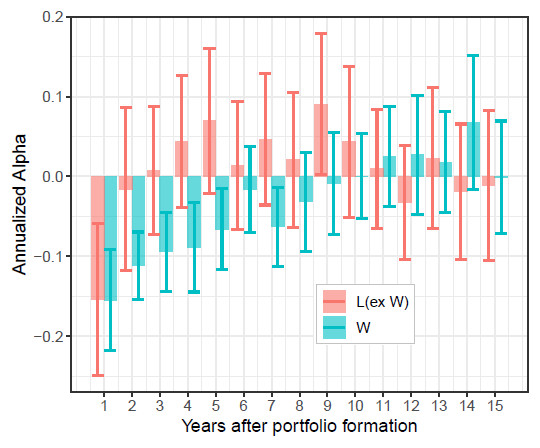
The following chart, taken from the paper, compares annualized 4-factor alphas by year after portfolio formation for value-weighted bubble losers that are not also past bubble winners [L (ex W)] and bubble winners [W] over the available sample period, along with 95% confidence intervals. Both losers and winners perform poorly during the first year. During years 2-5, losers perform normally but winners continue to underperform. In other words, bubbles collapse quickly for losers, but not for winners.
In summary, evidence indicates that momentum effects are unconventional for stocks that investors want to, but cannot readily, short.
In other words, long-only stock momentum investors may want to exclude bubble winners from their portfolios.
Cautions regarding findings include:
- Reported results are gross, not net. Accounting for trading frictions associated with monthly portfolio reformation would reduce returns.
- Exploitation of findings via shorting would inherently be very costly or infeasible because target stocks are costly/difficult to short.