Does margin debt serve as an intermediate-term stock market sentiment indicator based on either momentum (with an increase/decrease in margin debt signaling a continuing stock market advance/decline) or reversion (with change in margin debt signaling a pending reversal)? To investigate, we relate the behavior of NYSE end-of-month margin debt, published with a delay of about a month, with the monthly behavior of the S&P 500 Index as a proxy for the U.S. stock market. Using monthly data during January 1959 through August 2017 (703 months), we find that:
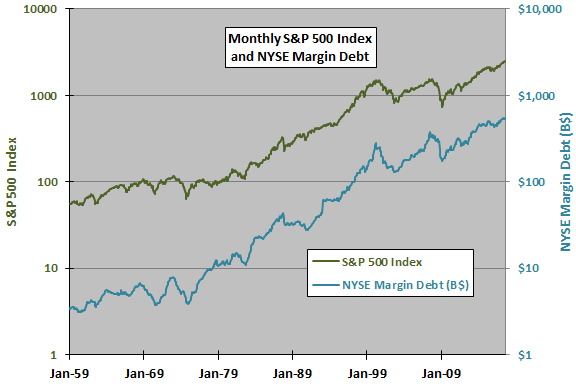
The following chart compares on logarithmic scales monthly values of the S&P 500 Index and NYSE margin debt in billions of dollars over the available sample period. It appears that the two series generally move together, with stock market peaks (dips) associated with contemporaneous margin debt peaks (dips). It is not clear whether one series leads the other.
Margin debt generally grows faster and is somewhat more volatile than the stock market over time. In other words, it appears that investor leverage drives a larger and larger part of aggregate market capitalization. The ratio of margin debt in billions to the S&P 500 Index (a rough proxy for U.S. market capitalization) grows from 0.06 to 0.22 over the sample period. Even during the (mild) de-leveraging of 2008-2009, the ratio of margin debt to the S&P 500 Index is higher than at any time before 2007.
For a closer look at the relationship, we relate monthly changes.
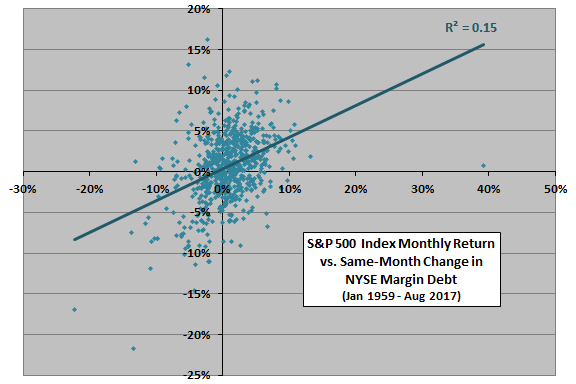
The following scatter plot relates monthly S&P 500 Index return to same-month change in NYSE margin debt over the available sample period. The Pearson correlation for the two series is 0.39 and the R-squared statistic is 0.15, indicating that monthly change in margin debt explains 15% of the same-month movement in the S&P 500 Index. This result confirms a tendency of the two series to move together.
However, the correlation between next-month S&P 500 Index return and monthly change in NYSE margin debt is 0.00 and the R-squared statistic therefore also 0.00, indicating that the latter has no ability to predict the former at a one-month horizon.
Does either series reliably lead the other over intervals up to six months?
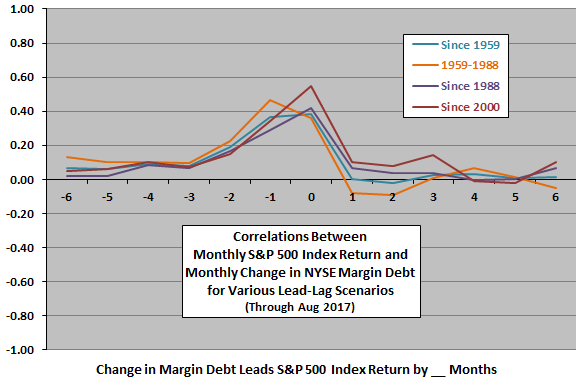
The next chart summarizes correlations between monthly S&P 500 Index returns and monthly changes in NYSE margin debt for various lead-lag scenarios ranging from stock market return leads margin debt change by six months (-6) to margin debt change leads stock market return by six months (6) for the full sample period and several subperiods.
Results consistently suggest that stock market return leads margin debt change by one or two months, with the lead perhaps shrinking a bit over time such that the coincident correlation is now strongest. In other words, a strong stock market last month indicates an increase in margin debt next month.
The subsample since 2000 (the last 210 months) offers a little support for belief that margin debt changes lead stock market returns (by one to three months). With the delay in publication of margin debt data, investors could exploit part of this lead.
As a check on recent usefulness of margin debt, we look at a rolling correlation.
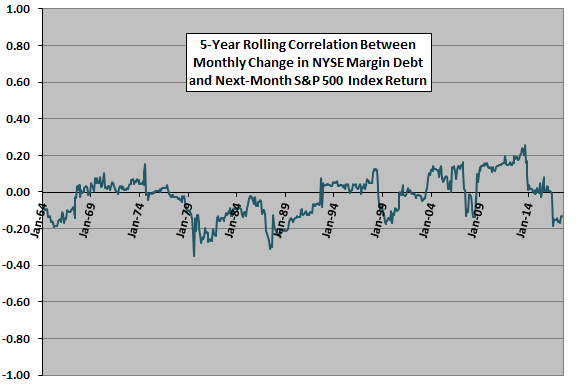
The next chart tracks the five-year (60-month) rolling correlation between next-month S&P 500 Index return and monthly change in NYSE margin debt. Results suggest that the correlation may be slightly increasing on average, but is unstable, with the correlation most recently near zero or negative.
Might there be an exploitable non-linearity in the relationship?
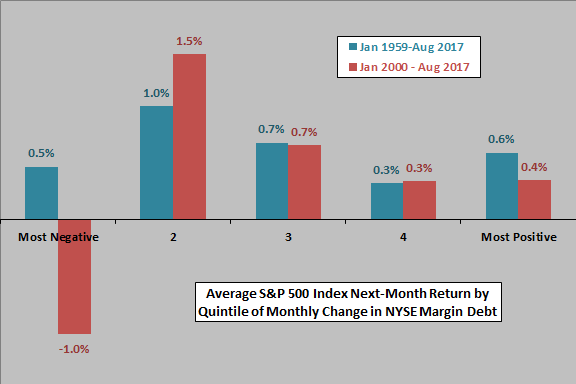
The next chart summarizes average next-month S&P 500 Index returns by ranked fifth (quintile) of monthly changes in NYSE margin debt over the full sample period (140-141 observations per quintile) and since the beginning of 2000 (only 42-43 observations per quintile). The unsystematic variations of average returns across quintiles undermine belief that variations in margin debt reliably predict stock market returns. The modest predictive power found above for the recent subperiod derives from strong negative momentum in stock market returns after the largest drops in margin debt.
Note that this kind of analysis is in-sample, such that an investor operating in real-time might not discover relationships in time to exploit them.
Might there be a longer-term relationship?
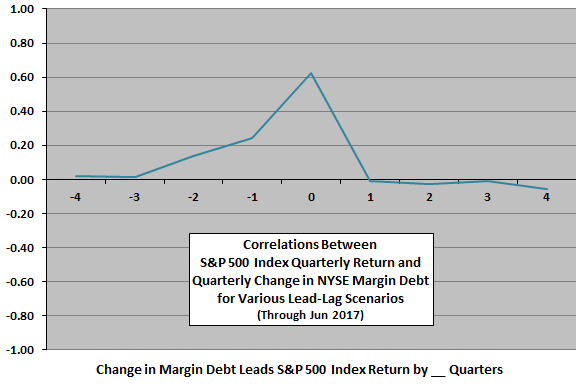
The final chart summarizes the correlations between quarterly S&P 500 Index returns and quarterly changes in NYSE margin debt for various lead-lag scenarios ranging from stock market return leads margin debt change by four quarters (-4) to margin debt change leads stock market return by four quarters (4) over the full sample period.
Results confirm that stock market return leads margin debt by a quarter. But, margin debt does not lead stock market return.
It is arguable that changes in margin requirements (degree of leverage allowed investors by brokers) could affect the relationship between the stock market and margin debt. However, the Federal Reserve Bank of San Francisco has concluded that “changes in [margin] requirements do not have a significant permanent effect on the behavior of stock prices”.
In summary, evidence from simple tests indicates that changes in margin debt tend to lag stock market returns by one or two months. Evidence provides very little support for belief that changes in margin debt predict stock market behavior.
Cautions regarding findings include:
- As noted, the above analyses are in-sample. Findings are generally too weak to motivate out-of-sample testing.
- As noted, quintile subsamples are small for reliable inference.
- Higher-frequency access to margin debt demand (and margin calls) may be informative.