Google Insights for Search enables users to “compare [normalized] search volume patterns across specific regions, categories, time frames and properties.” Does the search volume pattern for an exchange-traded fund (ETF) symbol reveal an investor/trader level of interest that later emerges predictably in price movements? For example, does the search volume pattern for “XLF” reliably indicate future price movements for the Financial Select Sector SPDR (XLF) ETF? Also, do broader search terms indicate overall stock market direction? Using weekly worldwide normalized search volumes for “XLF” (for the “Finance” category only) and XLF weekly dividend-adjusted prices during July 2007 through most of July 2012 (260 weeks), and weekly worldwide normalized search volumes for “bull market” and “bear market” (across all categories) and S&P 500 Index weekly levels during January 2004 through most of July 2012 (446 weeks), we find that:
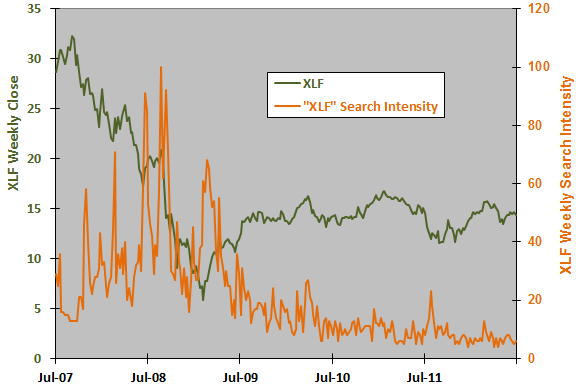
The following chart compares the weekly dividend-adjusted close for XLF with the same-week normalized “XLF” search volume (search intensity) over the available sample period. Note that the maximum search intensity is 100 because of the normalization approach. While search intensity peaks during a pronounced price decline, there is no obvious lead-lag relationship between the two series.
For a more precise test of the relationship, we look at weekly XLF return versus prior-week search intensity.
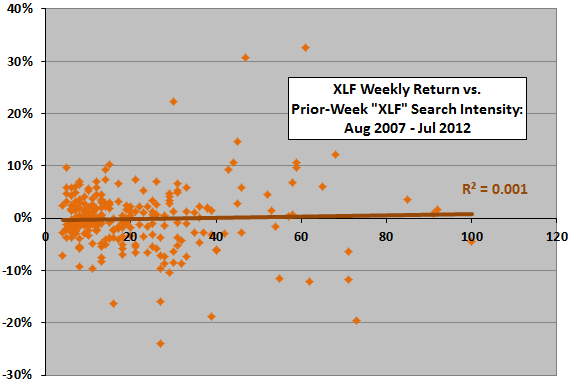
The following scatter plot relates weekly XLF return to prior-week “XLF” search intensity over the available sample period. The Pearson correlation for these two series is 0.04, and the R-squared statistic is 0.001, indicating that weekly “XLF” search intensity explains practically none of the next-week return.
In case there is a material non-linearity, we look at future XLF return by range of prior-week “XLF” search intensity.
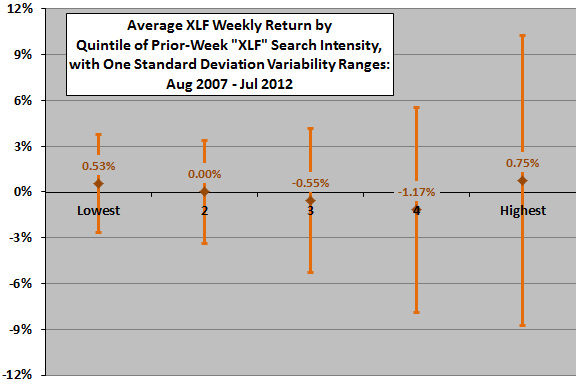
The next chart summarizes average XLF weekly returns and return variabilities by quintile (fifth) of prior-week “XLF” search intensity over the available sample period. Average return varies irregularly across quintiles. However, variability of returns increases systematically from lowest to highest search intensities.
Might search intensity be predictive over some longer horizon?
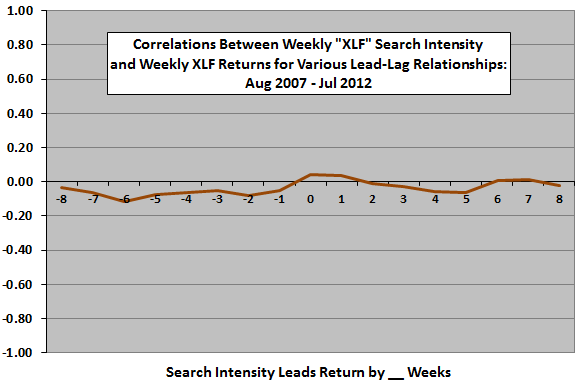
The next chart summarizes Pearson correlations between XLF weekly return and weekly “XLF” search intensity for various lead-lag relationships, ranging from return leads search intensity by eight weeks (-8) to search intensity leads return by eight weeks (8) over the available sample period. All correlations are small. The most suggestive indication is a persistently small negative correlation between past return and future search intensity. In other words, if XLF price has declined over past weeks, there may be a slight tendency for “XLF” search intensity to increase.
What about more general search terms and the broad stock market?
The next chart compares the weekly close of the S&P 500 Index with same-week normalized “bull market” and “bear market” search intensities over the available sample period. Again, maximum search intensity is 100 because of the normalization approach. “Bear market” search intensity, which appears to peak during stock market declines, appears potentially more telling. However, there is no obvious lead-lag relationship between search intensity and market performance.
Are there any reliable lead-lag relationships?

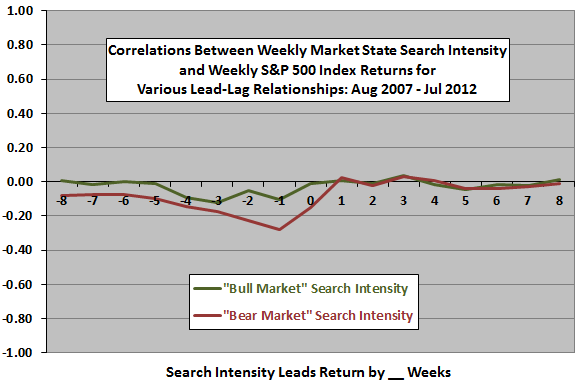
The next chart summarizes Pearson correlations between S&P 500 Index weekly return and weekly “bull market” and “bear market” search intensities for various lead-lag relationships, ranging from return leads search intensity by eight weeks (-8) to search intensity leads return by eight weeks (8) over the available sample period. There are indications that poor S&P 500 Index past returns stimulate increased searching, especially for the “bear market” term. However, search behavior does not predict stock market return.
Might there be a useful non-linearity in the relationship between search intensity and future stock market return?
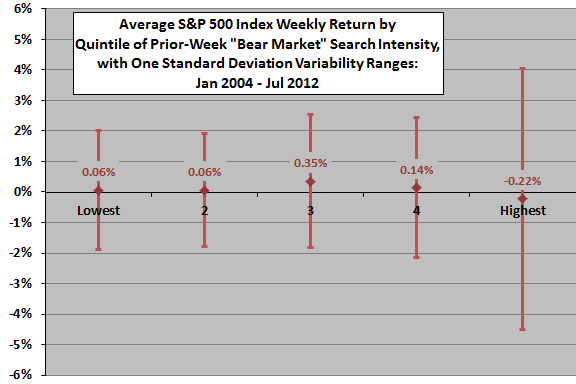
The final chart summarizes average S&P 500 Index weekly returns and return variabilities by quintile of prior-week “bear market” search intensity over the available sample period. As for XLF, average return varies irregularly across quintiles, but variability of returns increases systematically from lowest to highest search intensities.
In summary, evidence from simple tests does not support a belief that public interest in funds and stock market state as measured by normalized Google search volume predicts future returns, but the interest level may usefully predict return volatility.
Cautions regarding findings include:
- Results of Google Insights searches vary somewhat from day to day.
- The above analyses are in-sample. An investor operating in real time based strictly on historical data may draw different conclusions based on inception-to-date or rolling window historical subsamples.
- Volatility futures pricing derives from investor expectations for implied volatility, potentially confounding exploitation of the predictability of actual (realized) volatility.