Is there a useful way to measure the combined effects of information push (published supply) and pull (search demand) on investor attention to specific stocks? In his November 2012 paper entitled “The Impact of Information Supply and Demand on Stock Returns”, Yanbo Wang examines the effect of a shift in firm/stock information supply-demand metrics on stock returns. He measures information supply (demand) based on monthly number of relevant news articles (Google searches) about a company or its stock ticker. He treats supply (demand) as increasing or decreasing for a stock when the number of current-month news articles (Google searches) is above or below the 12-month average, respectively. The supply (demand) is zero if there are no news articles (Google searches) over the last 12 months. He thus considers nine combinations of information supply and demand for each stock. Using monthly news article and Google search counts (either by firm name or stock ticker symbol), prices and firm characteristics for a broad sample of U.S. common stocks during 2004 through 2011, he finds that:
- Based on stock ticker counts, the probability of having information supply and demand both increasing (decreasing) in a given month is on average 23.4% (24.8%).
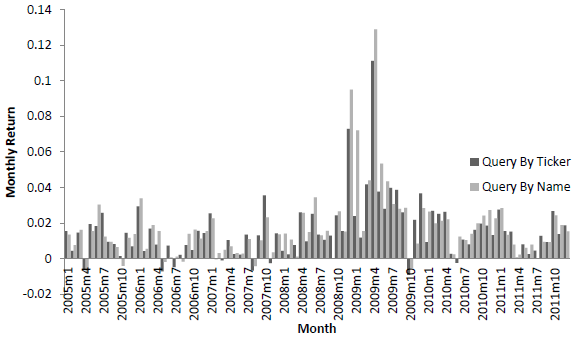
- The only combination that predicts future stock returns with statistical and economic significance is increases in both supply and demand for information (see the chart below). For example:
- A hedge portfolio that is each month long the equally weighted stocks with an increase in both supply and demand and short some other equally weighted supply-demand combination generates an average annual gross abnormal return (adjusting for market, size, book-to-market and momentum) of 16%-22%, with an annual gross Sharp ratio of 0.85-0.90 (compared to 0.05 for the S&P 500 Index).
- The average annual gross abnormal return is 23%-34% (7%-12%) for the fifth of stocks with the smallest market capitalizations (rest of the stocks).
- The average annual gross abnormal return is 24%-32% (3%-5%) for the fifth of stocks with the highest return volatilities (rest of the stocks).
- While the effect persists for 12 months after portfolio formation, it is concentrated in the first month.
- The effect is not tied to any one type of corporate event (such as announcements of earnings, strategic alliances or mergers).
- Results are generally robust to controls for price reversal, price momentum, trading volume, liquidity, institutional ownership, analyst coverage, news coverage, size, book-to-market ratio, profitability, operating efficiency and industry.
The following chart, taken from the paper, shows monthly gross returns in excess of the risk-free rate for portfolios that are each month long (short) the equally weighted stocks with an increase in both supply and demand (other stocks), based on news/searches for stock ticker and firm name, during 2005 through 2011. Based on stock ticker (firm name) the portfolio is profitable in 77 (78) of 84 months, and losses are small during unprofitable months. The average gross monthly excess return for the portfolio based on stock ticker (firm name) is 1.54% (1.74%), with standard deviation 1.70% (2.00%). The average monthly excess return for the S&P 500 Index over this period is 0.25%, with standard deviation 5.02%.

In summary, evidence suggests that investors may be able to exploit the strong short-term returns of stocks for which both supply of and demand for information is increasing, indicating elevated attention from other investors.
Cautions regarding findings include:
- Return calculations do not account for any costs of data services/search efforts required to perform monthly measurements of information supply and demand for each of a large number of stocks.
- Portfolio return calculations are apparently gross, not net. Trading frictions and shorting costs would materially lower reported returns, depending on turnover. Monthly turnover for the long side of the portfolio is apparently about two-thirds.
- Portfolio rules appear to specify monthly reformation at the same close as the end of the supply and demand measurement interval. Such anticipation of supply-demand measurements may be problematic when dealing with a large number of stocks.