“Verification Tests of the Smart Money Indicator” reports performance results for a specific version of the Smart Money Indicator (SMI) stocks-bonds timing strategy, which exploits differences in futures and options positions in the S&P 500 Index, U.S. Treasury bonds and 10-year U.S. Treasury notes between institutional investors (smart money) and retail investors (dumb money). Do these sentiment-based results diversify those for the Simple Asset Class ETF Momentum Strategy (SACEMS) and the Simple Asset Class ETF Value Strategy (SACEVS)? To investigate, we look at correlations of annual returns between variations of SMI (no lag between signal and execution, 1-week lag and 2-week lag) and each of SACEMS equal-weighted (EW) Top 3 and SACEVS Best Value. We then look at average gross annual returns, standard deviations of annual returns and gross annual Sharpe ratios for the individual strategies and for equal-weighted, monthly rebalanced portfolios of the three strategies. Using gross annual returns for the strategies during 2008 through 2019, we find that:
Because the SMI strategy has weekly signals, we take the last release date for the underlying Traders in Financial Futures, Futures-and-Options Combined Reports during a calendar year as the end of the year for the strategy.
The following table summarizes gross annual performance statistics as described above for the following strategies/portfolios:
- SMI: SPY-TLT No Lag – switching between SPDR S&P 500 (SPY) and iShares 20+ Year Treasury Bond (TLT) at the next close after release of underlying weekly reports.
- SMI: SPY-TLT 1-week Lag – switching between SPY and TLT one week after release of underlying weekly reports.
- SMI: SPY-TLT 2-week Lag – switching between SPY and TLT two weeks after release of underlying weekly reports.
- SACEMS EW Top 3 – as specified at Simple Asset Class ETF Momentum Strategy.
- SACEVS Best Value – as specified at Simple Asset Class ETF Value Strategy.
- EW: No Lag – equal-weighted, monthly rebalanced portfolio of SMI: SPY-TLT No Lag, SACEMS EW Top 3 and SACEVS Best Value.
- EW: 1-week Lag – equal-weighted, monthly rebalanced portfolio of SMI: SPY-TLT 1-week Lag, SACEMS EW Top 3 and SACEVS Best Value.
- EW: 2-week Lag – equal-weighted, monthly rebalanced portfolio of SMI: SPY-TLT 2-week Lag, SACEMS EW Top 3 and SACEVS Best Value.
For portfolios 6, 7 and 8, we take the last release date for the underlying Traders in Financial Futures, Futures-and-Options Combined Reports during a calendar month as the end of the month for the strategy. The risk-free rate for Sharpe ratio calculations is each year the average end-of-month 3-month U.S. Treasury bill yield during that year. Notable points are:
- Correlations between SMI variations and both SACEMS and SACEVS are very low, lower than that between SACEMS and SACEVS, indicating good diversification potential. In other words, the SMI sentiment measure is very different from both multi-class momentum and value.
- Combining SACEMS and SACEVS with any SMI variation substantially suppresses annual volatility and boosts gross Sharpe ratio.
For perspective, we look at cumulative performance of some of the above.

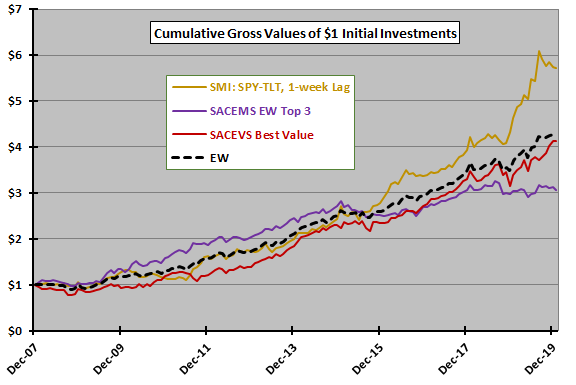
The following chart compares cumulative gross performances of $1 initial investments at the end of December 2007 in four strategies. EW is the equal-weighted, monthly rebalanced portfolio of the other three.
Performance of EW is particularly steady across market environments. Maximum drawdowns for the four strategies based on monthly data are, in order, -16%, -13%, -23% and -11%.

In summary, available evidence suggests that Smart Money Indicator-based strategy variations attractively diversify SACEMS and SACEVS, with combination portfolios having low volatilities.
Cautions regarding findings include:
- The sample period is very short for evaluation of annual performance statistics, so confidence in findings is not high.
- As noted, performance statistics are gross, not net. Trading frictions are higher for SACEMS EW Top 3 than for SMI-based strategy variations, and higher for SMI than for SACEVS Best Value.
- As noted, mismatches between weekly SMI-related report dates and ends of calendar months and years introduce some approximations.
- Cautions in “Verification Tests of the Smart Money Indicator”, Simple Asset Class ETF Momentum Strategy and Simple Asset Class ETF Value Strategy apply.