What is the total return to U.S. single family (house) rentals? In their February 2021 paper entitled “Total Returns to Single Family Rentals”, Andrew Demers and Andrea Eisfeldt analyze total returns to U.S. single family rentals, decomposed into net rental yield and house price appreciation. To estimate net rental yields, they:
- Weight city-level gross rental yields by number of rental houses in each ranked tenth (decile) of house prices to account for prevalence of low-priced houses.
- Empirically estimate rental operating and renovation costs as a fraction of home value, size or rent.
- Apply state-specific or city-specific real estate taxes and vacancy rates.
Using monthly home prices and rental estimate inputs by zip code for the 30 largest U.S. cities during 1986 through 2014, they find that:
- On average, net rental yield is about 60% of gross yield.
- Overall nominal total return on U.S. single family rentals is about 8.5%. For high-priced (low-priced) cities, the return is about 7.9% (9.2%).
- On average overall, net rental yield (4.2%) and house price appreciation (4.3%) contribute about half of total return and are negatively correlated (see the first chart below). On average, cities with the lowest (highest) fifth, or quintile, of house prices have net rental yield 6.1% (2.4%) and house price appreciation 3.1 (5.5%).
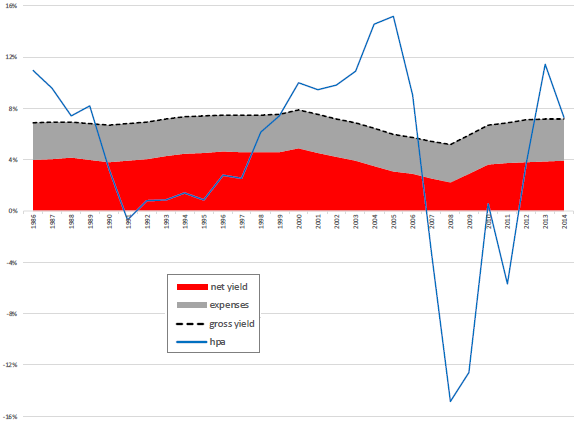
- Rental yield is much less volatile than house price appreciation (see the second chart below), implying a higher Sharpe ratio for single family rentals with larger rather than smaller return contributions from rental yields
- At the zip code level within cities, low-priced zip codes have higher total returns than high-priced zip codes due to both higher rental yield and greater house price appreciation, with variability driven by yield. In fact, house price appreciation does not increase (and may decrease) with price.
The following chart, taken from the paper, summarizes annualized average U.S. city-level house price appreciations (HPA), net rental yields and total returns from lowest (1) to highest (5) house price quintiles over the full sample period. Results show largely offsetting variations of HPA and net rental yield, with the former increasing with price and the latter decreasing.

The next chart, also from the paper, tracks U.S. gross rental yield, expense rate, net rental yield and house price appreciation (hpa) at the national level over the full sample period. National net rental yield is a city population-weighted average of city-level medians. House price is annual from June to June. Results show that house price appreciation is far more volatile than rental yield.

In summary, evidence indicates that total return to renting single family homes is competitive with stock market return, with about half coming from fairly stable net rental yield and half from highly volatile property appreciation.
Framed differently, a typical long-term home owner-occupant in the U.S. has a total return on the home, relative to renting an equivalent residence, close to the return on the U.S. stock market.
Cautions regarding findings include:
- The sample period is not long in terms of sequential intervals of long-term house ownership. In slight mitigation, the authors report that available data after 2014 covers only the top 15 U.S. cities, and findings for a 15 city-sample during 1986 through 2019 are similar to those above.
- Findings may not apply to small town/rural settings.
- As noted in the paper, houses are illiquid. Buying and selling frictions for entering and exiting the single family rental market would materially lower total return.
- Per “Private Property as an Investment Class”, housing returns may be more idiosyncratic than city-level or zip code-level findings.
- Returns do not account for the fact that home ownership generally involves leverage (mortgages).
See also “Worldwide Long-run Returns on Housing, Equities, Bonds and Bills”.