Do real estate investments protect investors from inflation? In their November 2011 paper entitled “Inflation and Real Estate Investments”, Bradford Case and Susan Wachter examine whether real estate investment returns protect consumers from loss of purchasing power. They focus on publicly traded stocks of U.S. equity real estate investment trusts (REIT) as the most transparent source of real estate returns and compare the inflation protection of these returns to those of other assets. They compare returns directly to the inflation rate rather than calculating return-inflation rate correlations. Specifically, they establish a base scenario that: (1) assumes an investment horizon of six months; (2) focuses on the six-month intervals during which annualized inflation exceeds its median (3.2% for the sample); and, (3) measures the frequency with which returns equal or exceed inflation during these high-inflation intervals. Using monthly U.S. consumer price index (CPI) and index return data for equity REITs, commodities, U.S. stocks (S&P 500 Index), U.S. TIPS and gold during January 1978 (modeled prior to January 1997 for TIPS) through August 2011 (399 overlapping six-month intervals), they find that:
- Over the entire sample period:
- Average annual consumer price inflation is 3.9%.
- Average annual growth rate of REIT dividends is 7.7%.
- REIT dividend income exceeds inflation in 306 of 404 months.
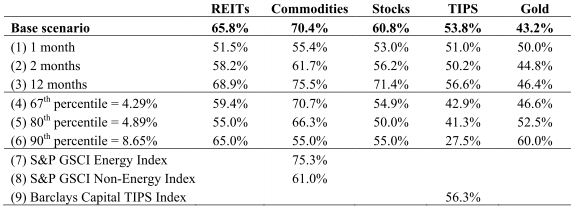
- Based on the criterion of returns at least matching inflation during high-inflation six-month intervals, commodities (70.4%) and equity REITs (65.8%) provide the best inflation protection, followed by stocks (60.8%), TIPS (53.8%) and gold (43.2%). However, these results are sensitive to some base scenario assumptions (see the table below).
- During high-inflation six-month intervals (average annualized inflation 6.1%), commodities have the strongest average gross annualized return (19.2%), followed by equity REITs (12.3% total return and 8.6% from dividends), stocks (10.2%), TIPS (6.9%) and gold (6.0%).
- During low-inflation six-month intervals (average annualized inflation 1.8%), equity REITs have the strongest average gross annualized return (13.7% total return and 6.9% from dividends), followed by stocks (13.0%), TIPS (9.2%), gold (7.2%) and commodities (-2.4%).
- Over the entire sample period, TIPS and equity REITs together account for at least half of a mean-variance optimized portfolio over much of the risk-return spectrum, with TIPS especially important in low-volatility portfolios and REITs especially important in high-return portfolios.
- The allocation with the strongest gross risk-adjusted performance is 48.9% TIPS, 16.9% equity REITs, 14.6% commodities, 13.9% stocks and 5.8% gold. This portfolio generates an average gross annual real return of 7.5%, with 11.7% volatility and 0.54 Sharpe ratio. During high-inflation (low-inflation) six-month intervals, this allocation generates a gross annual Sharpe ratio of 0.48 (0.60). During high-inflation intervals, its nominal gross returns at least match inflation 74.9% of the time.
- The allocation that eliminates directional risk for inflation is 54.1% TIPS, 21.8% commodities, 14.5% equity REITs, 6.4% stocks and 3.3% gold. This portfolio generates an average gross annual real return of 7.1%, with 11.3% volatility and 0.52 Sharpe ratio. During high-inflation intervals, its nominal gross returns at least match inflation 75.4% of the time.
- The categories of publicly traded equity REITs with the highest frequencies of nominal returns at least matching inflation during high-inflation six-month intervals are self-storage (81.0%) and residential (77.8%), followed by shopping centers (73.0%), lodging (68.3%), regional malls (69.8%), office (69.8%), health care (68.3%) and free-standing retail (61.9%).
- Conclusions seem applicable to less liquid real estate assets.
The following table, taken from the paper summarizes the inflation protection capabilities (frequency of producing gross nominal returns that at least match inflation) for nine alternatives to the base scenario:
- A one-month measurement interval (instead of six-month) results in similar inflation protection capabilities for all asset classes. For a two-month measurement interval, commodities and REITs offer the best protection and gold the worst. For a 12-month measurement interval, commodities, stocks and REITs offer the best protection and gold still the worst.
- As the definition of “high-inflation” grows more extreme (toward safe haven), the inflation protection capabilities of commodities and TIPS decrease notably, while that of gold increases. However, sample size falls (ultimately to 40 six-month intervals) with this progression.
- Energy-related commodities offer more dependable inflation protection than non-energy commodities. Use of recent actual TIPS series rather than a model-extended version has little effect on the inflation protection of this asset class.

In summary, evidence from the past 33+ years indicates that equity REITs (and leveraged real estate more generally) may offer dependable protection against inflation and play an important role in asset class diversification.
Cautions regarding findings include:
- Returns are gross, not net. Including reasonable index implementation/rebalancing frictions would materially reduce returns and inflation protection frequencies. Moreover, since frictions may vary by asset class, using net returns may alter hedging and asset allocation conclusions.
- Definitions of high-inflation and low-inflation regimes are in-sample (retrospective). An investor operating in real time would experience a dynamic definition.
- Portfolio optimization results are in-sample (retrospective). An investor optimizing in real time would have inferred different optimized allocations at different times during the sample period.
- The portfolio optimization methodology assumes that asset class return distributions are normal. To the extent they are not, this methodology breaks down.
- While the study delineates high-inflation and low-inflation regimes, it provides no insight on predicting them.
- The sample period is short in terms of number of secular inflationary/disinflationary trends.