The U.S. Democratic and Republican political parties arguably exhibit persistently different policy inclinations that affect the aggregate performance of public companies and therefore the U.S. stock market. “Party in Power and Stock Returns” investigates annual stock returns for different combinations of the party in control of the the Presidency, the House of Representatives and the Senate on a binary basis (Democrat or Republican). Do future stock market returns vary systematically with party composition and change in party composition of Congress? To investigate, we relate Republican composition of the House and Senate and prior session-to-session change in Republican composition to U.S. stock market returns during the session. Using party representation in Congress and stock index data for the Shiller data set since 1871, the Dow Jones Industrial Average (DJIA) since 1929 and the S&P 500 Index since 1951, we find that:
Assumptions used in calculations are as follows:
- Republican composition of the House (Senate) is the number of seats held by Republicans divided by the total seats in the House (Senate).
- Change in Republican composition of the House (Senate) is the change in the number of House (Senate) seats held by Republicans from the prior two-year session of Congress to the current session divided by the total seats in the House (Senate) for the current session.
- To discriminate between impacts of elections and legislation, the future stock market return is the two-year return measured either based on:
- An election cycle from the end of the October before the legislative session to the end of the last October during the session, or
- A Congressional session cycle from the end of the December before the legislative session to the end of the last December during the session. We include the current partial session cycle using data through October 2010.
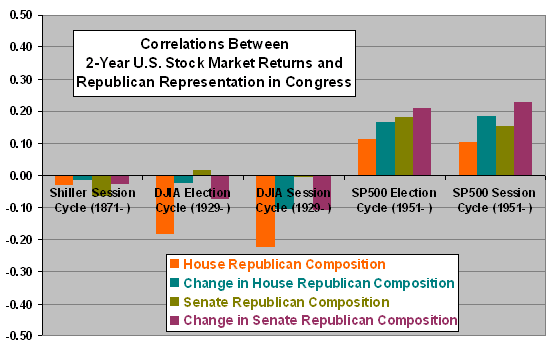
The following chart summarizes correlations between two-year future U.S. stock market returns and Republican representation/change in representation in Congress as specified. Because of the way Robert Shiller calculates index levels, we distinguish between election and session cycles only for the DJIA and the S&P 500 Index. Results suggest that:
- Over the 1871-2010 sample period, stock market returns have little or no relationship with Republican composition of Congress.
- Over the 1929-2010 subperiod, the stock market shows a slight preference for Democrats in Congress.
- Over the 1951-2010 subperiod, the stock market shows a preference for Republicans in Congress.
Whether one interprets the recent subperiod (using the S&P 500 Index) as the most indicative of expectation for the next two years depends on a qualitative trade-off of sample size versus relevancy to current environment.
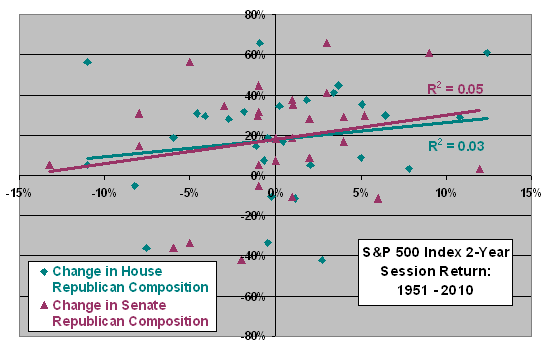
To get a sense of what these correlations mean in terms of reliability of expectation, we generate a scatter plot.

The following scatter plot relates S&P 500 Index Congressional session cycle returns to the changes in Republican composition of the House and Senate from the last session to the current session over the 1951-2010 subperiod (through October 2010). The R-squared statistics indicate that changes in Republican composition of the House and Senate explain 3% and 5% of session stock market returns, respectively.

Note that:
- If we use Democratic rather than Republican composition/change in composition, correlations would be similar in magnitude but opposite in sign.
- The above analyses ignore the effects of crossing the majority power threshold in both the House and the Senate and the 60/40 power threshold in the Senate. They also ignore the effect of which party holds the Presidency. Imposition of such conditions would produce very small subsamples.
In summary, evidence from simple tests is mixed regarding implications for the U.S. stock market of party composition shifts in Congress. Results from the most recent subperiod suggest the bigger the Republican win in 2010, the stronger the stock market the next two years.