Do U.S. stock market returns have any connection to presidential election polling data? In other words, do investors act on the survey-indicated election prospects for the two major party candidates? Presumably, investors would tend to enter (exit) stocks if they thought the candidate with policies more (less) favorable for equity valuation were gaining ground. Using daily releases of Gallup head-to-head polling data for the 2008 presidential election (Obama-McCain for March 11 through November 2) and the 2012 presidential election (Obama-Romney for April 15 through October 16) and contemporaneous daily closing levels of the S&P 500 index, we find that:
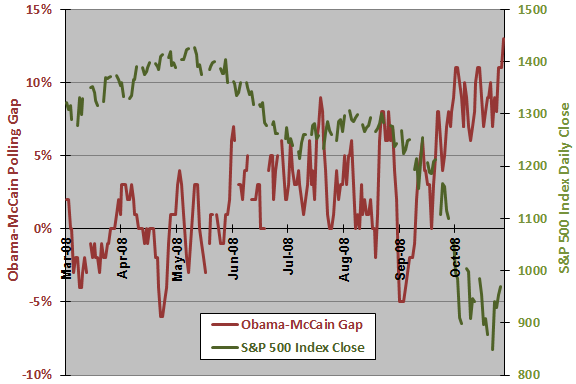
The following chart compares the daily Gallup polling preference gap between Senator Obama and Senator McCain to the level of the S&P 500 index over the 2008 sample period. Each day’s preference gap is the result of surveys of registered voters conducted over the prior three to five days. Gallup releases new results at 1 PM on the day after the last day of each polling interval. Holes in each series represent days for which Gallup releases no new polling results or days on which the U.S. stock market is closed (weekends and holidays).
Visual inspection suggests that investors grow more pessimistic (optimistic) when Senator Obama (McCain) gains ground.
For greater precision, we examine the lead-lag relationship between daily changes in polling data and daily stock market returns.

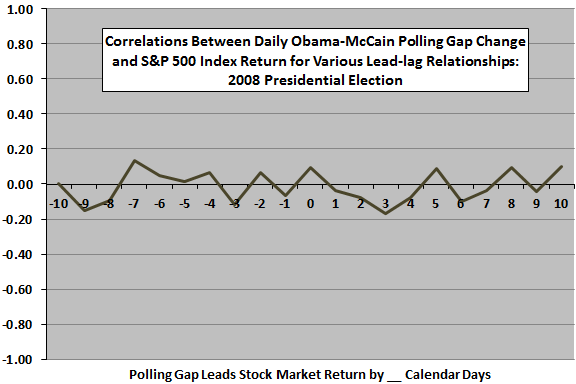
The next chart summarizes correlations for the daily change in Obama-McCain polling gap versus daily S&P 500 Index returns for lead-lag relationships ranging from stock index return leads the polling gap change by 10 calendar days (-10) to the polling gap change leads stock index return by 10 calendar days (10). Results indicate random fluctuations across lead-lag times. In other words, changes in the polling gap and stock market returns are practically unrelated over the short term.
In case there is a meaningful non-linearity, we rank the daily polling gap changes and calculate the average next-day S&P 500 Index returns for:
- 65 trading days just after Senator Obama gains ground (-0.6%).
- 38 trading days just after there is no change in the gap (-0.3%).
- 56 trading days just after Senator McCain gains ground (+0.4%).
Results suggest investor preference for Senator McCain.
What about the 2012 election?

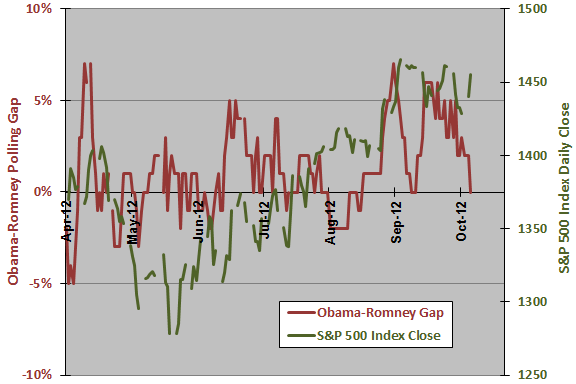
The next chart compares the daily Gallup polling preference gap between President Obama and Governor Romney to the level of the S&P 500 index during mid-April through mid-October 2012. Each day’s preference gap is the result of surveys of registered voters conducted over the prior five or six days. Gallup releases new results at 1 PM on the day after the last day of each polling interval. Holes in each series represent days for which Gallup releases no new polling results or days on which the U.S. stock market is closed (weekends and holidays).
Visual inspection indicates no obvious relationship between the two series.
For greater precision, we examine the lead-lag relationship between daily changes in polling data and daily stock market returns.

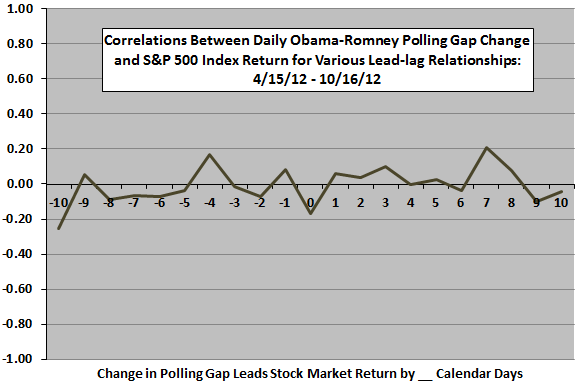
The final chart summarizes correlations for the daily change in Obama-Romney polling gap versus daily S&P 500 Index returns for lead-lag relationships ranging from stock index return leads the polling gap change by 10 calendar days (-10) to the polling gap change leads stock index return by 10 calendar days (10). Results indicate random fluctuations across lead-lag times. In other words, changes in the polling gap and stock market returns are practically unrelated over the short term.
In case there is a meaningful non-linearity, we rank the daily polling gap changes and calculate the average next-day S&P 500 Index returns for:
- 34 trading days just after President Obama gains ground (+0.1%).
- 52 trading days just after there is no change in the gap (0.0%).
- 35 trading days just after Governor Romney gains ground (0.0%).
Results suggest investor indifference regarding which candidate wins.

In summary, limited evidence indicates that daily presidential election polling data have very little or no effect on short-term returns for the broad U.S. stock market.
Cautions regarding findings include:
- Samples are limited in both duration and financial market conditions.
- The Gallup survey of registered voters relies on arguably stale data and may not be the poll most influential with investors.