Do published stock factors exhibit performance streaks exploitable via intrinsic (absolute, or time series) and relative (cross-sectional) momentum? In the March 2021 revision of their paper entitled “Factor Momentum and the Momentum Factor”, Sina Ehsani and Juhani Linnainmaa investigate stock factor portfolio monthly time series and cross-sectional momentum. They consider 15 factors for U.S. stocks (size, value, profitability, investment, momentum, accruals, betting against beta, cash flow-to-price, earnings-to-price, liquidity, long-term reversals, net share issuance, quality minus junk, residual variance and short-term reversals) and seven of these factors for global stocks. Each factor portfolio is long (short) stocks with higher (lower) expected returns based on that factor. They each month measure factor momentum as factor portfolio return from 12 months ago to one month ago. They consider six factor momentum strategies and one benchmark strategy that all exclude the stock momentum factor and are all rebalanced monthly and equal-weighted, as follows:
- Time Series Winners – long factor portfolios with positive momentum.
- Time Series Losers – long factor portfolios with negative momentum.
- Time Series Hedge– long Time Series Winners and short Time Series Losers.
- Cross-sectional Winners – long factor portfolios with above-median momentum.
- Cross-sectional Losers – long factor portfolios with below-median momentum.
- Cross-sectional Hedge – long Cross-sectional Winners and short Cross-sectional Losers.
- Benchmark – long all factor portfolios.
Using monthly returns as available for the 15 U.S. stock anomalies since July 1963 and seven of these anomalies applied to global stocks since July 1990, all through December 2019 (mostly Kenneth French data), they find that:
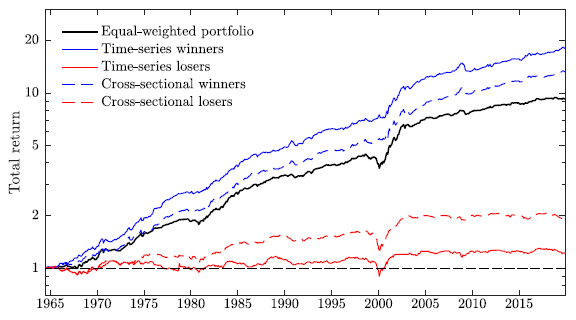
- Profits of time series and cross-sectional factor momentum strategies are large and significant. For the U.S. sample (see the chart below):
- The benchmark strategy has average annualized gross return 4.1%, with gross annualized Sharpe ratio 1.04.
- Time Series Winners, Losers and Hedge strategies have average annualized gross returns 5.9%, 0.8% and 3.9%, respectively, with gross annualized Sharpe ratios 1.35, 0.14 and 0.94.
- Cross-sectional Winners, Losers and Hedge strategies have average annualized gross returns 6.4%, 1.7% and 2.4%, respectively, with gross annualized Sharpe ratios 1.21, 0.32 and 0.68.
- Time series factor momentum outperforms cross-sectional factor momentum because it is the purer bet on factor return autocorrelations.
- Results imply that stock momentum is not a distinct factor but instead a combination of autocorrelations of other factors.
The following chart, taken from the paper, compares on a logarithmic scale gross cumulative performances of the benchmark strategy and the Time Series and Cross-sectional Winner and Loser factor momentum strategies outlined above. Both Loser strategies markedly underperform the benchmark, and both Winners strategies beat the benchmark, with Time Series Winners performing best.

In summary, evidence indicates that investors may be able to exploit stock factor momentum by focusing on factors with the most positive recent returns.
Cautions regarding findings include:
- Factor portfolios are essentially indexes and do not account for costs of maintaining liquid tracking funds. These portfolios have short sides that involve shorting costs and constraints based on availability of shares to borrow.
- Monthly portfolio reformation requires additional trading frictions that would reduce reported returns.
- Data required to calculate anomaly returns may not have been available in a timely manner over the full sample period, suggesting presence of look-ahead bias.
- Monthly analysis and trade execution burdens are beyond the reach of most investors, who would bear fees when delegating to a fund manager.
See also “Stock Anomaly Momentum Strategy” and “Beat the Market with Hot-Anomaly Switching?”.