Subscribers have suggested an alternative approach for the “Simple Asset Class ETF Momentum Strategy” (SACEMS) designed to suppress trading by holding past winners until they fall further in the rankings than in the baseline specification. SACEMS each month picks winners from the following set of exchange-traded funds (ETF) based on total returns over a specified lookback interval:
PowerShares DB Commodity Index Tracking (DBC)
iShares MSCI Emerging Markets Index (EEM)
iShares MSCI EAFE Index (EFA)
SPDR Gold Shares (GLD)
iShares Russell 2000 Index (IWM)
SPDR S&P 500 (SPY)
iShares Barclays 20+ Year Treasury Bond (TLT)
Vanguard REIT ETF (VNQ)
3-month Treasury bills (Cash)
There are three versions of SACEMS: (1) top one of the nine ETFs (Top 1); (2) equally weighted top two (EW Top 2); and, (3) equally weighted top three (EW Top 3). To test the suggestion, we specify three “sticky” versions of SACEMS as follows:
- Top 1 Sticky – retains the past winner until it drops out of the top 2.
- EW Top 2 Sticky – retains past winners until they drop out of the top 3.
- EW Top 3 Sticky – retains past winners until they drop out of the top 4.
We compare sticky and baseline strategies using the tabular performance statistics used for the baseline. Using monthly total (dividend-adjusted) returns for the specified assets during February 2006 (limited by DBC) through December 2017, we find that:
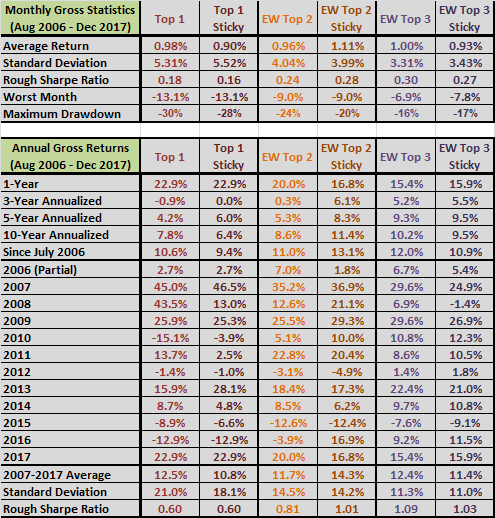
The following tables compare monthly and annual gross performance statistics for the baseline and sticky versions of SACEMS over the available sample period. Notable findings are:
- Top 1 Sticky mostly performs a little worse than baseline Top 1.
- EW Top 2 Sticky performs better than baseline EW Top 2.
- EW Top 3 Sticky performs a little worse than baseline EW Top 3.
Given the noisiness of monthly ETF returns, differences between sticky and baseline alternatives are not statistically strong. Investors who are very sensitive to trading frictions may want to use a sticky version, which does eliminate many trades (ignoring perfect monthly rebalancing of multi-ETF portfolios). For example, for Top 1, Sticky SACEMS switches 34 times over the sample period (about three times per year) compared to 55 times (five times per year) for the baseline strategy.
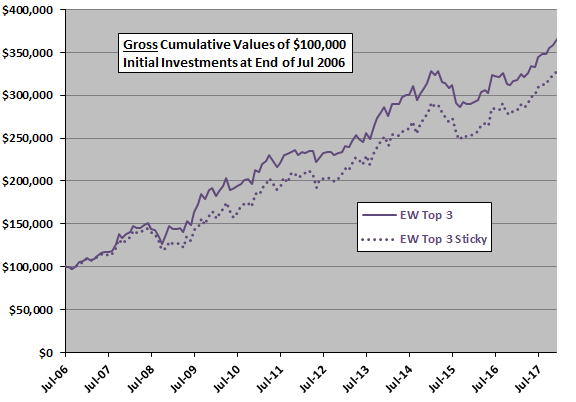
For additional perspective, we look at cumulative performances for EW Top 3.

The following chart compares gross cumulative performances of $100,000 initial investments in baseline EW Top 3 and EW Top 3 Sticky over the available sample period. Theoretically, one might expect the sticky alternative to be less responsive to asset class crashes, and this chart perhaps supports that expectation.

In summary, evidence from simple tests over the available sample period does not support a belief that making SACEMS winners “sticky” to suppress trading is better or much worse than acting immediately on monthly indications.
Cautions regarding findings include:
- Sample size is modest (about 29 independent 5-month momentum ranking intervals). Concentration of the performance difference depicted above for EW Top 3 during the unusual environment of the financial crisis amplifies this concern.
- As noted, mixed findings are not very reliable due to noisiness of monthly ETF return data.
- Other cautions in “Simple Asset Class ETF Momentum Strategy” apply.
See also “Buffered Winner Asset Class ETF Momentum Strategy”.