The Simple Asset Class ETF Momentum Strategy (SACEMS) each month picks the one, two or three of nine asset class proxies with the highest cumulative total returns over a specified lookback interval. A subscriber proposed instead using the optimal intrinsic (time series or absolute) momentum lookback interval for each asset rather than a common lookback interval for all assets. SACEMS and the proposed approach represent different beliefs (which could both be somewhat true), as follows:
- Many investors adjust asset class allocations with some regularity, such that behaviors of classes are important and coordinated.
- Many investors switch between specific asset classes and cash with some regularity, such that each class may exhibit distinct times series behavior.
To investigate, we consider two ways to measure intrinsic momentum for each asset class proxy:
- Correlation between next-month return and average monthly return over the past one to 12 months. The lookback interval with the highest correlation has the strongest (linear) relationship between past and future returns and is optimal.
- Intrinsic momentum, measured as compound annual growth rate (CAGR) for a strategy that is in the asset (cash) when its total return over the past one to 12 months is positive (zero or negative). The lookback interval with the highest CAGR is optimal.
We use the two sets of optimal lookback intervals (optimization-in-depth) to calculate momentum for each asset class proxy as its average monthly return over its optimal lookback interval. We then compare performance statistics for these two alternatives to those for base SACEMS, focusing on: gross CAGR for several intervals; average gross annual return; standard deviation of annual returns; gross annual Sharpe ratio; and, gross maximum drawdown (MaxDD). Using monthly dividend-adjusted prices for SACEMS asset class proxies during February 2006 through September 2019, we find that:
Per prior research, SACEMS portfolios each month hold the Top 1, equally weighted (EW) Top 2 or EW Top 3 assets based on 4-month past returns from among the following eight exchange-traded funds (ETF) plus cash:
- PowerShares DB Commodity Index Tracking (DBC)
- iShares MSCI Emerging Markets Index (EEM) until December 2007, and iShares JPMorgan Emerging Markets Bond Fund (EMB) thereafter
- iShares MSCI EAFE Index (EFA)
- SPDR Gold Shares (GLD)
- iShares Russell 2000 Index (IWM)
- SPDR S&P 500 (SPY)
- iShares Barclays 20+ Year Treasury Bond (TLT)
- Vanguard REIT ETF (VNQ)
- 3-month Treasury bills, or T-bills (Cash)
Availability of DBC determines beginning of the sample period, and return calculations start in March 2007 to accommodate the longest (12-month) lookback interval. Calculations assume that past returns and portfolio reformation occur at the same monthly close (winners can be slightly anticipated) and ignore trading frictions and tax implications. The risk-free rate for a year in Sharpe ratio calculations is the average monthly T-bill yield during that year.
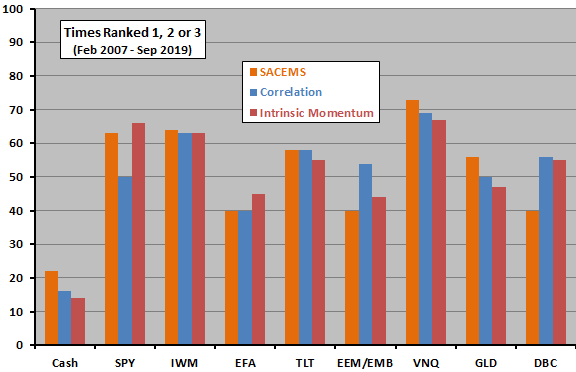
The following chart compares distributions of monthly top three assets across the three strategies over the full sample period. Overall, distributions are similar. The clearest difference is that optimization-in-depth strategies tilt more toward (non-gold) commodities than does base SACEMS.
A principal difference between correlation and intrinsic momentum optimizations-in-depth is an assumption of linearity in relationships between past returns and next-month returns for the former.
How do these distributions translate into performance?
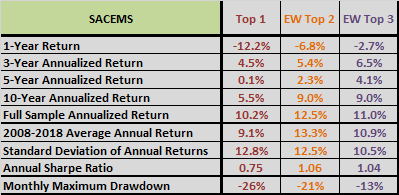
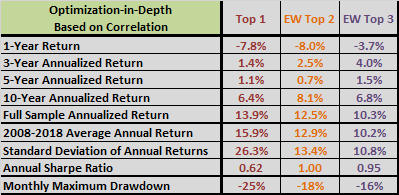
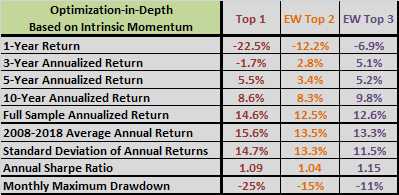
The following three tables summarize gross performance statistics for base SACEMS (upper chart), optimization-in-depth via correlation (middle chart) and optimization-in-depth via intrinsic momentum (lower chart) over the full sample period. Overall, the last alternative wins, though with especially weak recent performance.
However, in-sample optimization impounds data snooping bias, and optimization-in-depth involves much more snooping that does base SACEMS (eight parameters versus one). It is reasonable to suspect that some or all of any improvement is due to snooping bias (lucky choices).
Out-of-sample testing would alleviate snooping bias. For example, re-estimating optimal intervals periodically (say, monthly or annually) using only past data and applying these intervals to future months. However, the available sample is so short (fewer than 13 independent 12-month lookback intervals) that out-of-sample testing is problematic. Also, re-estimation of optimal intervals is burdensome.
As a simple robustness test, we see whether optimal intervals are similar for the first and second halves of the available sample.
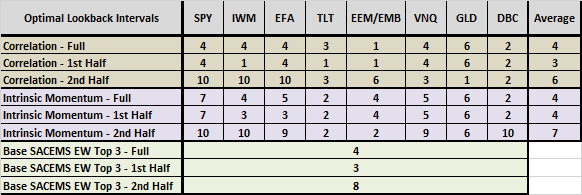
The final table shows optimal lookback intervals by asset class proxy for the full sample period and the first and second halves of the sample period (break point at the end of May 2013) for both optimization-in-depth alternatives. For comparison, it also shows optimal lookback intervals for the base SACEMS EW Top 3 portfolio (based on CAGR) over the same periods. In general:
- Full sample and first half optimal intervals are similar, and shorter than second half optimal intervals.
- Differences in optimal intervals between the first and second halves are most pronounced for equities. The first half includes a deep and sharp equity bear market, and the second half is a fairly continuous bull market.
Taken together, these two results suggest that tuning to equity bear market conditions is more important than tuning to equity bull market conditions (see “Asset Class Momentum Faster During Bear Markets?”). However, subsamples have only six independent 12-month measurement intervals each, undermining belief in findings.
In summary, evidence indicates that, ignoring snooping bias, optimization of SACEMS lookback intervals by individual asset class proxy (optimization-in-depth) may be attractive. Available data do not support out-of-sample testing rigorous enough to mitigate concern about snooping bias.
Cautions regarding findings include:
- As noted, the available sample for the full SACEMS universe of ETFs is very short for discriminating between similar competing strategies.
- As noted, optimization-in-depth involves considerable data snooping (eight optimizations versus one for base SACEMS), arguably removing the “S” from SACEMS. A short sample exacerbates snooping bias. Drawing conclusions based on the above in-sample testing is risky.
See also: