A subscriber asked for an update on whether weekly or biweekly (every two weeks) measurement of asset class momentum works better than monthly measurement as used in “Simple Asset Class ETF Momentum Strategy (SACEMS)” (SACEMS). Do higher measurement frequencies respond more efficiently to market turns? To investigate, we compare performances of strategies based on monthly, weekly and biweekly frequencies with comparable lookback intervals. For this comparison, we align weekly and biweekly results with monthly results, though they differ somewhat due to mismatches between ends of weeks and ends of months. We consider portfolios of past ETF winners based on Top 1 and on equally weighted (EW) Top 2 and Top 3. Using weekly dividend-adjusted closing prices for the asset class proxies per baseline SACEMS and the yield for Cash during February 2006 through April 2020, we find that:
We use 17-week and 9-biweek lookback intervals as most comparable to the baseline 4-month lookback interval used in baseline SACEMS. However, the three intervals differ by a few days (four months is on average about 17.4 weeks). Assumptions and methodology are the same as for baseline SACEMS. For comparisons, we use use weekly and biweekly portfolio values nearest month ends. Differences in return streams should largely cancel over the sample period.
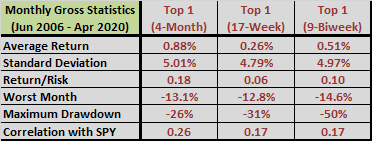
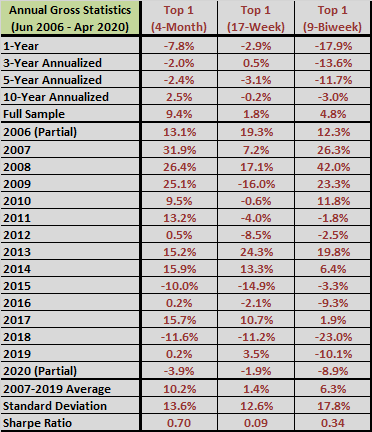
The following tables summarize gross monthly performance statistics (upper table) and annual performance statistics (lower table) for SACEMS Top 1 based on monthly, weekly and biweekly measurement frequencies.
Monthly statistics include average monthly return, standard deviation of monthly returns, reward-to-risk ratio (average monthly return divided by standard deviation of monthly returns), worst monthly return, maximum drawdown based on monthly returns and correlation of monthly returns with SPDR S&P 500 (SPY). Annual statistics include annualized returns, which are compound annual growth rates (CAGR), annual returns and Sharpe ratio. To calculate excess annual return used in the Sharpe ratio, we use average monthly yield on 3-month Treasury bills during a year as the risk-free rate for that year.
Notable points are:
- The baseline monthly measurement interval works best.
- The very poor performance of weekly measurements appears to be unlucky. Full-sample gross CAGRs for 18-week and 19-week lookbacks (not shown) are around 6-7%.
- Similarly, the performance of biweekly measurements appears unlucky, with gross CAGRs around 6-7% for 8-biweek and 10-biweek lookbacks.
- Higher measurement frequencies generate more trades (226 trades for weekly, 145 for biweekly and 83 for monthly measurements over the full sample period), translating to higher portfolio rebalancing frictions. In other words, using gross returns is favorable to weekly and biweekly measurement frequencies compared to a monthly frequency.
Two possible interpretations are: (1) noisier higher-frequency data is less informative than lower-frequency data; and/or, (2) higher-frequency data is more subject to reversals at the expense of momentum than lower-frequency data.
For perspective, we compare cumulative Top 1 performances.
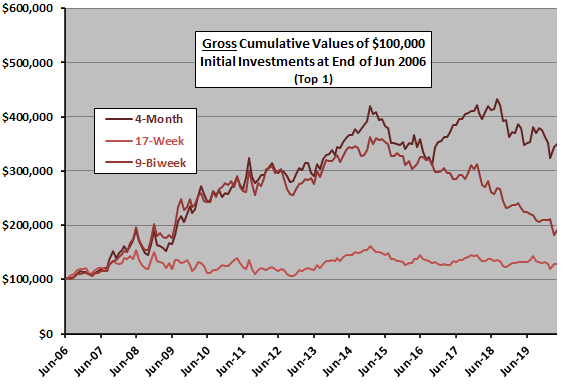
The following chart tracks gross cumulative performances of SACEMS Top 1 based on monthly, weekly and biweekly measurement frequencies. Results generally confirm tabular data. All three measurement frequencies suggest a regime change around the end of 2014.
Next, we look at EW Top 2 portfolios.
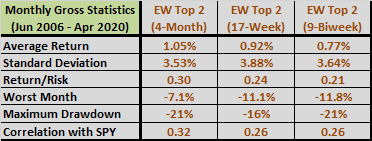
The next two tables summarize gross monthly performance statistics (upper table) and annual performance statistics (lower table) for SACEMS EW Top 2 based on monthly, weekly and biweekly measurement frequencies. Notable points are:
- The baseline monthly measurement interval again works best.
- Weekly measurements are next best and competitive with monthly measurements based on gross annual Sharpe ratio.
- Again, higher measurement frequencies translate to higher portfolio turnovers.
For perspective, we compare cumulative EW Top 2 performances.
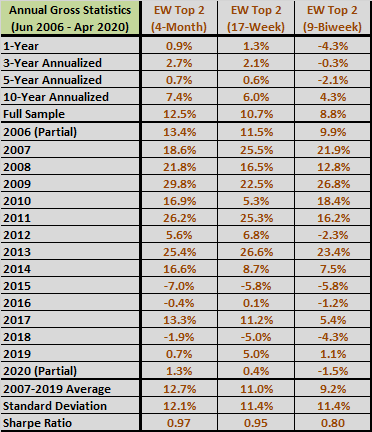
The next chart tracks gross cumulative performances of SACEMS EW Top 2 based on monthly, weekly and biweekly measurement frequencies. Results generally confirm tabular data and again suggest a regime change around the end of 2014.
Next, we look at EW Top 2 portfolios.
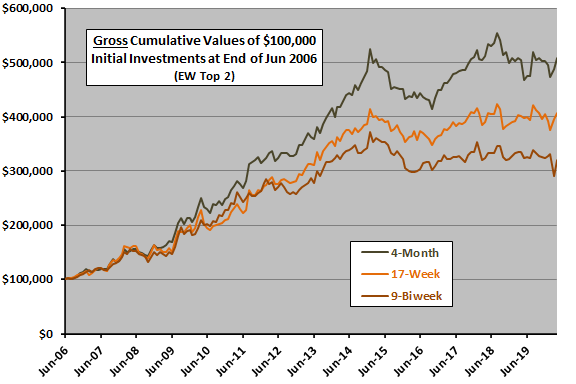
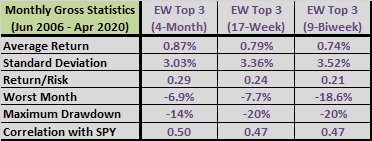
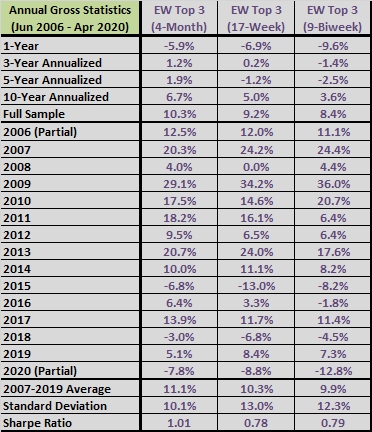
The final pair of tables summarize gross monthly performance statistics (upper table) and annual performance statistics (lower table) for SACEMS EW Top 3 based on monthly, weekly and biweekly measurement frequencies. Notable points are:
- The baseline monthly measurement interval again works best.
- Weekly measurements are mostly next best, but annual statistics are similar for weekly and biweekly.
- Again, higher measurement frequencies translate to higher portfolio turnovers.
For perspective, we compare cumulative EW Top 3 performances.
The final chart tracks gross cumulative performances of SACEMS EW Top 3 based on monthly, weekly and biweekly measurement frequencies.
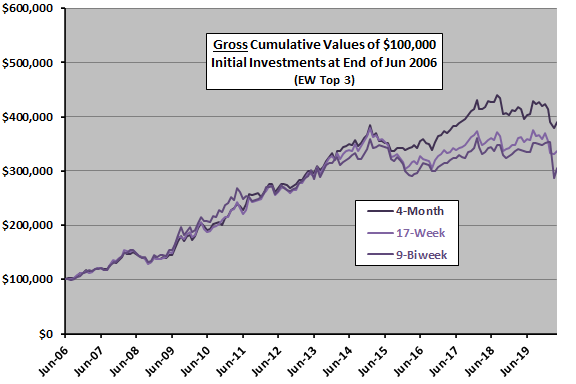
In summary, evidence from the available sample does not support belief that weekly or biweekly measurement frequencies improve SACEMS performance, especially after accounting for higher switching frictions.
Cautions regarding findings include:
- Sample size is modest (about 42 independent lookback intervals).
- As noted, monthly and annual measurements are slightly misaligned for end-of-week versus end-of-month data.
- As noted, analyses are gross. Accounting for costs of regular portfolio reformation would reduce returns, and performance reduction deepens as portfolio reformation frequency increases.
- Weekly and biweekly measurement frequencies require more effort than monthly measurements.
- Other weekly and biweekly lookback intervals may work better, but experimentation would elevate data snooping bias, which is especially pernicious for noisier higher-frequency measurements.
- Other cautions noted in “Simple Asset Class ETF Momentum Strategy” apply.