Does the U.S. stock market exhibit reliable and exploitable trends as measured by intrinsic (absolute or time series) momentum? In their April 2020 paper entitled “Time Series Momentum in the US Stock Market: Empirical Evidence and Theoretical Implications”, Valeriy Zakamulin and Javier Giner examine evidence of time series momentum in the excess returns (relative to the risk-free rate) of the S&P Composite Index. Their approach involves autocorrelations of multi-month (not monthly) excess returns. They then use simulations modeled with actual index return statistics to; (1) assess potential profitability of long-only and long-short time series momentum strategies; and, (2) estimate the optimal lookback interval. Using monthly total returns for the S&P Composite Index and the monthly risk-free rate represented by the U.S. Treasury bill (T-bill) yield during January 1857 through December 2018, they find that:
- An optimized long-only time series momentum strategy beats buy-and-hold on a gross basis with 30% higher monthly Sharpe ratio. However, an optimized long-short strategy is not profitable.
- The distribution of simulated returns for the long-only strategy resembles that a portfolio insurance strategy, offering not only a higher gross Sharpe ratio but also better downside protection.
- The power of the statistical test for superiority of long-only time series momentum over buy-and-hold is weak. Simulations indicate that:
- Over horizons of five to 10 years, the probability that optimized long-only time series momentum beats buy-and-hold is less than 60%.
- Achieving an 80% probability that optimized long-only time series momentum beats buy-and-hold requires about 250 years of monthly observations.
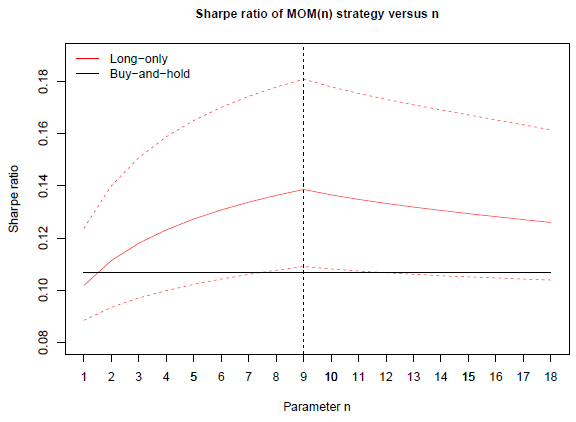
- The optimal lookback interval for long-only time series momentum is about nine months over the full sample, but the precision of this estimate is poor even for a sample of hundreds of years of monthly observations. In other words, investors studying typical, relatively short, historical samples would have difficulty identifying the optimal lookback interval. However, long-only time series momentum performance is fairly robust across lookback intervals (see the chart below).
The following chart, taken from the paper, relates long-only gross monthly Sharpe ratios for time series momentum strategies (MOM) as simulated based on S&P Composite Index statistics across lookback intervals (n) ranging from one to 18 months. The solid red line in the figure plots gross monthly Sharpe ratios, and the dashed red lines identify the 95% confidence intervals for these estimates. The black horizontal line is the monthly Sharpe ratio for buy-and-hold. Results indicate that gross outperformance of the time series momentum strategy relative to buy-and-hold is robust to choice of lookback interval.

In summary, evidence indicates that the U.S. stock market exhibits somewhat reliable and exploitable medium-term (long only) time series momentum over very long investment horizons.
Cautions regarding findings include:
- Constructing the very long sample used in the study requires assumptions that introduce some uncertainty in findings.
- As noted, Sharpe ratios are gross, not yet. There is no easy way to trade the overall U.S. stock market over much of the extremely long sample period, and associated frictions for switching between stocks and cash may thus be problematic.
- The investment horizon needed to achieve high confidence in time series momentum beating buy-and-hold, even with optimized lookback interval, is longer than any individual investor’s horizon.
- Results may differ for other asset classes (see “Optimal Intrinsic Momentum and SMA Intervals Across Asset Classes”, which for a short sample does not confirm optimality of a 9-month lookback interval for the U.S. stock market).