Is there a way to predict when stock price momentum strategies will thrive or crash? In the October 2014 update of their draft paper entitled “Time-Varying Momentum Payoffs and Illiquidity”, Doron Avramov, Si Cheng and Allaudeen Hameed investigate the relationship between future momentum strategy profitability and market illiquidity. They measure momentum conventionally as the average gross monthly return of a portfolio that is each month long the value-weighted tenth (decile) of common stocks with the highest and short the value-weighted decile of common stocks with the lowest returns from 12 months ago to one month ago (with a skip-month to avoid short-term reversal). Their stock illiquidity metric is the Amihud measure (average daily price impact per monetary volume traded over the past month), and they measure market illiquidity as the value-weighted average stock illiquidity. Using daily and monthly prices and market capitalizations for a broad sample of U.S. common stocks, monthly equity risk factors, investor sentiment and firm earnings data as available during January 1926 through December 2011, they find that:
- Over the entire sample period, the momentum strategy:
- Generates an average gross monthly return of 1.18%.
- Has a three-factor (market, size, book-to-market) monthly gross alpha of 1.73%.
- Exhibits strongly negative skewness, indicative of occasional large crashes.
- Tends to be less profitable when prior 24-month market return is negative and when prior-month market volatility (standard deviation of daily returns last month) is high.
- High market illiquidity tends to depress subsequent momentum strategy profitability. Specifically:
- The correlation between prior-month market illiquidity and monthly momentum return is -0.26.
- A one standard deviation increase in market illiquidity reduces momentum gross profitability by an average 0.87% the next month.
- More specifically, when market illiquidity is high:
- Autocorrelations (serial correlations) of individual stock returns tend to be relatively low.
- The illiquidity gap between winner and loser deciles widens, and loser stocks earn an unusually large illiquidity premium.
- Findings are robust to different illiquidity measures, macroeconomic conditions, dispersion of returns across stocks, investor sentiment and restriction of the sample to large stocks.
- The predictive power of market illiquidity exceeds that of both past market return and past market volatility.
- While the momentum strategy is not significantly profitable during the last decade of the sample period, it is still profitable during the parts of the decade when the market is relatively liquid. Specifically:
- The average gross monthly return is 1.09% (-0.69%) when the market during the prior month is relatively liquid (illiquid).
- The relationship between market liquidity and an earnings momentum strategy is nearly identical.
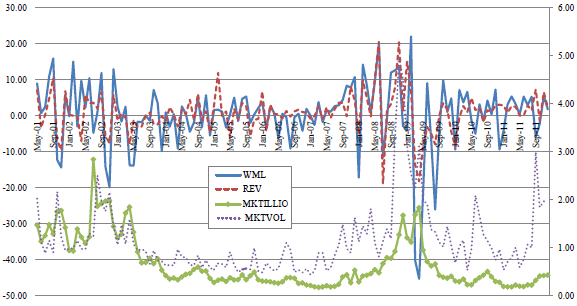
The following chart, taken from the paper, tracks the behaviors of the following four series during May 2001 through December 2011 (first two on the left-hand scale, and second two on the right-hand scale):
- Gross profitability of the price momentum portfolio (WML).
- Gross profitability of a similar earnings momentum strategy based on revisions in analyst forecasts as of the end of the past return measurement interval used in the price momentum strategy (REV).
- Market illiquidity (MKTILLIQ) at the time of portfolio formation.
- Market volatility (MKTVOL) at the time of portfolio formation.
The figure suggests that the lack of profitability of the momentum strategy in the recent decade follows episodes of market illiquidity during 2000-2002 and 2008-2009.

In summary, evidence indicates that stock market illiquidity predicts stock momentum strategy profitability, and that considering market illiquidity could help momentum investors exploit favorable conditions and avoid crashes.
Cautions regarding findings include:
- The study reports gross, not net, returns. Accounting for trading frictions and costs/feasibility of shorting would materially reduce these returns. Since some of the stocks driving momentum returns tend to be illiquid, they may bear high trading frictions and may be difficult to short.
- Moreover, given the interplay between trading frictions (contributions of bid-ask spread and impact of trading) and market illiquidity, findings based on net returns may differ from those based on gross returns.
- The effort required to calculate stock market illiquidity is significant or, if delegated to a manager, potentially costly.