A subscriber asked for an extended test of a very simple momentum strategy that each month holds Vanguard 500 Index Fund Investor Shares (VFINX) or Vanguard Long-Term Treasury Fund Investor Shares VUSTX according to which of these funds has the highest total return over the last three months. To investigate, based on the way mutual funds report prices, we calculate past 3-month total returns using dividend-adjusted prices for month-ends and strategy returns using dividend adjusted prices for first days of the following month. We assume zero fund switching costs and no restrictions on monthly fund switching. We use buying and holding VFINX as a benchmark. Using the specified fund price series and monthly 3-month U.S. Treasury bill (T-bill) yield from the end of May 1986 (limited by VUSTX) through the beginning of March 2021, we find that:
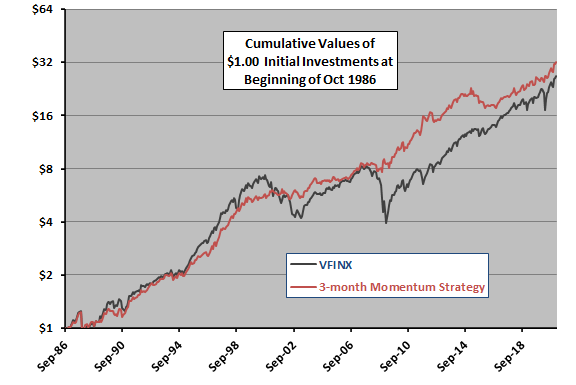
The following compares on a logarithmic scale cumulative values of the 3-month momentum switching strategy and VFIMX over the available sample period (with start date allowing calculation of initial 3-month fund returns). The momentum strategy avoids several deep drawdowns, most importantly that of 2008, but underperforms the benchmark for some extended subperiods.
For precision, we look at monthly and annual performance statistics.

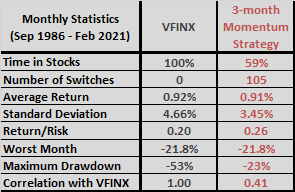
The following table summarizes monthly performance statistics for VFINX and the 3-month momentum strategy over the full sample period. Return/Risk is average monthly return divided by standard deviation of monthly returns. Maximum drawdown is the deepest peak-to-trough drawdown during the sample period.
The momentum strategy, via about three switches per year on average, has lower volatility and much shallower maximum drawdown than VFINX. The correlation of monthly returns with VFINX is relatively low.
What about annual performance?

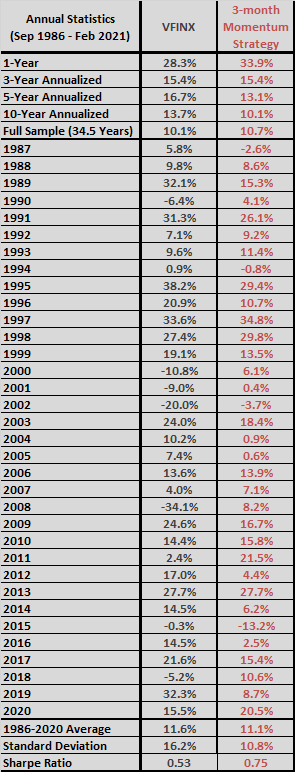
The next table summarizes annual performance statistics for VFINX and the 3-month momentum strategy over the full sample period. The upper section presents annualized returns, which are compound annual growth rates (CAGR). The middle section presents returns year-by-year. The bottom section includes annual Sharpe ratio, calculated with monthly excess returns over the T-bill yield.
The momentum strategy is generally preferable due to lower annual volatility than VFINX.
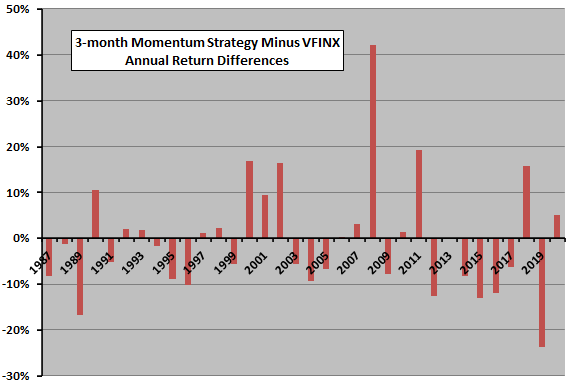
For perspective, we visualize annual return differences.

The final chart shows the difference in annual returns between the 3-month momentum strategy and VFINX during 1987 through 2020. The strategy outperforms (underperforms) VFINX in 14 (18) of 34 years. The difference for 2008 is key.

In summary, evidence indicates that a strategy of switching between proxies for the S&P 500 Index and long-term U.S. Treasury bonds based on 3-month past returns is attractive to investors insensitive to potential tax impacts of switching funds.
Sensitivity testing indicates that the 1-day execution delay does not degrade performance compared to end-of-month execution based on anticipated signals.
Cautions regarding findings include:
- As noted, attractiveness of the momentum strategy depends to a material degree on the presence of the 2008 equity market crash/U.S. Treasury bond boom in the sample.
- As noted, there are long subperiods of momentum strategy underperformance relative to the benchmark that may discourage investors following the strategy.
- There is data snooping bias from selection of a 3-month lookback interval based on prior research, such that the backtest likely overstates momentum strategy performance out-of-sample.
- In taxable accounts, there would be tax impacts from trading. There may have been restrictions on frequent fund switching during part of the sample period.
For related research, see results of this search.