Academic tests of momentum generally involve frequent adjustments to portfolios of many stocks, such that trading frictions and shorting/capacity restrictions make implementation impractical for both large and small investors. Are there simplified approaches that successfully shed trading frictions faster than momentum returns? In the October 2010 version of their paper entitled “Feasible Momentum Strategies in the US Stock Market”, Manuel Ammann, Marcel Moellenbeck and Markus Schmid measure the returns of simple, low-cost momentum strategies restricted to the relatively liquid U.S. stocks in the S&P 100 Index. They form portfolios monthly for nine combinations of ranking and holding periods (3, 6 and 12 months for both), including a skip-month between ranking and formation to avoid reversals. They consider the best-performing 1, 3, 5 and 10 stocks for long positions and either their worst-performing counterparts or the S&P 100 Index for short positions. They impose an overarching annual rebalancing scheme across different holding periods to suppress return volatility. Using total return data for the stocks in the S&P 100 Index as it exists at time of portfolio formation spanning 1982 through 2009, they find that:
- A long position in the single strongest past winner generates a higher gross return than those generated by more diversified portfolios holding the strongest 3, 5 or 10 past winners.
- Shorting the S&P 100 Index is substantially superior as a hedge to shorting individual past loser stocks, resulting in higher gross returns and lower gross return volatility.
- Momentum strategies that are long (short) the single strongest past winner (S&P 100 Index) generate average monthly gross returns of 1.16% to 2.05%.
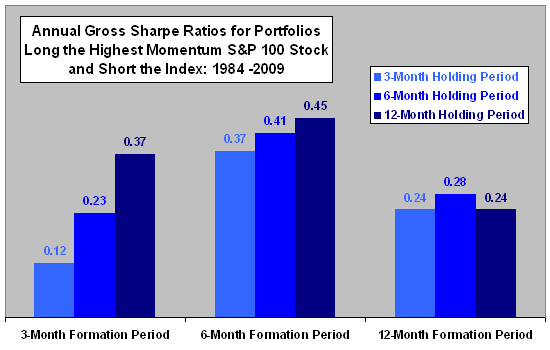
- The 6-month ranking period produces the largest gross returns and highest gross Sharpe ratios (see the charts below).
- Translating gross returns to net:
- One-way trading friction of 0.2% decreases gross monthly returns by about 0.16%, 0.10% and 0.07% for holding periods of 3, 6 and 12 months, respectively.
- The strategy with the highest average gross monthly return, 6-month ranking and 3-month holding periods, remains significantly profitable (positive) for one-way trading friction up to 0.75% (1.93%). The strategy with the highest annual gross Sharpe ratio, 6-month ranking and 12-month holding periods, remains significantly profitable (positive) for one-way trading friction up to 1.33% (3.16%).
- Results are generally robust to adjustment for market, size and book-to-market factors and for various macroeconomic indicators.
The following chart, constructed from data in the paper, summarizes annual gross Sharpe ratios across different combinations of ranking and holding periods for the best-performing level of diversification, long (short) the single strongest past winner (S&P 100 index), over the period 1984 through 2009. Results indicate that a 6-month ranking period outperforms other ranking periods and that longer holding periods outperform shorter ones. Longer holding periods have the additional advantage of lower trading frictions over the long run.

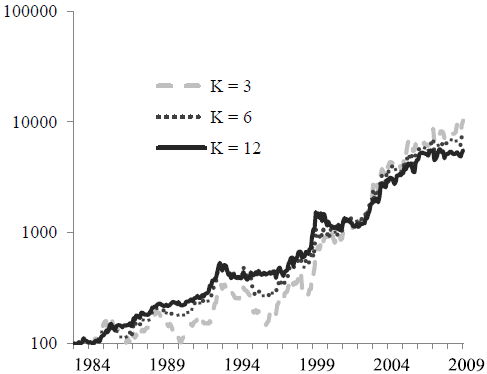
The next chart, taken from the paper, compares the gross cumulative performances of momentum strategies based on the best diversification approach (long the strongest past winner and short the S&P 100 Index) and the best ranking period (6-month) for holding periods of 3, 6 and 12 months over the entire 1984-2009 test period. Results suggest that momentum is stronger during the second half of the sample period than during the first half. While the strategy with the 3-month holding period has the highest terminal value, it also has the highest volatility and the weakest performance during the first half of the sample period.

In summary, evidence from straightforward tests indicates that a simple momentum strategy that is long (short) the strongest past winner from the S&P 100 Index (the index itself) generates economically and statistically significant returns over the past 26 years.
Reservations about this conclusion are:
- Testing of multiple variations of ranking period, holding period and number of stocks (along with other variations) incorporates data snooping bias, such that the best strategy combination likely overstates reasonable performance expectations.
- The measurement approach in the paper, with monthly formation of portfolios that overlap in time (and may hold the same stock at the same time) and annual rebalancing across categories (strands) of portfolios defined by holding periods, implicitly incorporates diversification that an implementing investor is unlikely to achieve. The authors report that eliminating duplicate holdings and omitting the annual rebalancing substantially lower gross returns across strategy variations.
- The authors (understandably) translate gross to net returns via static levels of trading friction. In fact trading friction varied considerably over the sample period (see “Trading Frictions Over the Long Run”). Also, for much of the sample period, there is no simple (low-cost) way to short the S&P 100 Index. The market may adapt to the decline in trading friction over the past two decades by more aggressively exploiting known sources of gross outperformance, thereby suppressing net outperformance.
- The measure of statistical significance used in the paper assumes a normal distribution of stock returns. To the extent the actual return distribution is wild, this test is not informative.