What is the best way to balance crash protection and false alarms for intrinsic, also called absolute or time series, momentum strategies that are long (short) an asset when its return over a specified past interval is positive (negative)? In their November 2019 paper entitled “Momentum Turning Points”, Ashish Garg, Christian Goulding, Campbell Harvey and Michele Mazzoleni investigate blending slow and fast intrinsic momentum signals with various weights on each (adding to one) to identify the best way to handle reversals in trend direction. They specify a slow (fast) signal as that derived from past 12-month (1-month) excess return. They define four market states: (1) Bull (slow and fast signals both non-negative); (2) Correction (slow signal non-negative and fast signal negative); (3) Bear (slow and fast signals both negative); and, (4) Rebound (slow signal negative and fast signal non-negative). They first consider static weights in increments of 25% for slow and fast signals. They then consider a dynamic strategy with slow and fast signal weights that differ for Correction and Rebound states as identified with monthly data. They test usefulness of the dynamic strategy by optimizing weights with historical returns and then evaluating performance of these weights out-of-sample. While focusing on the U.S. stock market, they test robustness of findings across other developed country equity markets. Using monthly excess returns for the U.S. value-weighted stock market since July 1926 and for 10 other developed stock markets since February 1980, all through December 2018, they find that:
- During 1969-2018, the U.S. stock market is in Bull, Correction, Bear and Rebound states 48.3%, 24.5%, 16.7% and 10.5% of the time, respectively. Average annualized excess return is 5.9%, with annualized volatility 15.6% and annualized Sharpe ratio 0.38.
- During Bull and Bear states, surprises in economic variables are significantly positive and negative, respectively. During Corrections and Rebounds, surprises in these variables are not significant. Surprise interest rate cuts (hikes) are associated with Rebound (Correction) states.
- For static weights applied to the U.S. sample during 1969-2018:
- Equal weighting of slow and fast signals generates the highest gross annualized Sharpe ratio (0.51) and close to the shallowest maximum drawdown (-34%) by scaling down positions after Correction and Rebound months, thus avoiding volatility without sacrificing average return.
- Market betas are small in magnitude, near zero for intermediate weights.
- Return distribution skewness increases from negative to slightly positive with weight on the fast signal.
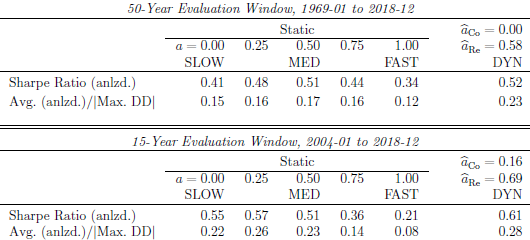
- Optimized dynamic weights offer some gross improvements compared to static weights when applied to the U.S. stock market (see the table below). Best performance generally derives from signal blends that are relatively slow after Corrections and relatively fast after Rebounds. For example, optimized weights by market state during July 1926 through December 1968:
- Are 0% (58%) weight on the fast signal during Corrections (Rebounds).
- Generate gross annualized Sharpe ratio 0.52 during 1969-2018, compared to 0.51 for static equal weights.
- Generate average annualized return divided by magnitude of maximum drawdown 0.23 during 1969-2018, compared to 0.17 for static equal weights.
- Findings largely apply to other developed country equity markets except Japan, where static intermediate-speed strategies beat a dynamic strategy.
The following table, extracted from the paper, compares gross annualized Sharpe ratios and ratios of gross annualized average return to magnitude of maximum drawdown (Max. DD) for static and dynamic blend intrinsic momentum strategies over long and recent short sample periods (evaluation windows). For the long (short) evaluation window, the dynamic strategy estimation period is July 1926 through December 1968 (December 2003). The table includes the optimized dynamic strategy weights for Correction and Rebound market states. Notable findings are:
- The best static weights differ for the long and short samples.
- The dynamic blend strategy offers modest improvements over the best static strategies.
- Optimized dynamic strategy weights are generally slow blends during Corrections and intermediate-to-fast blends for Rebounds.
In summary, evidence indicates that the best intrinsic momentum strategies for equity markets are for intermediate lookback intervals, with some advantages to using different rules during market corrections and rebounds.
Cautions regarding findings include:
- Results are gross, not net. Accounting for portfolio long-short switching frictions would reduce all returns. Since slow (fast) signals change relatively infrequently (frequently), accounting for these frictions may change findings about best signal weights. The authors do not compare turnovers for alternative strategies. The authors argue that frictions for implementation with S&P 500 Index futures would be modest, but:
- Futures are not available over entire long test periods, and future returns may differ from spot returns (because they incorporate investor expectations for the term of the futures).
- Futures trading frictions may not be constant over available histories.
- It is not obvious that blending slow and fast signals (from long and short lookback intervals) has any advantages over testing single lookback intervals.
- Testing multiple strategies on the same data introduces data snooping bias, such that the best-performing strategy overstates expectations.
- The study does not address any asset classes other than equities.
See also “Slow Down or Speed Up SACEMS with Volatility?” and “Asset Class Momentum Faster During Bear Markets?”.