Do trend following strategies widely used by managed futures funds break down during financial crises? In the December 2013 version of their paper entitled “Is This Time Different? Trend Following and Financial Crises”, Mark Hutchinson and John O’Brien examine the effectiveness of trend following strategies as applied to futures contract series during and between financial crises. They define a financial crisis interval as the two to four years after the start of the crisis. They consider six global crises: (1) the Great Depression commencing 1929: (2) the 1973 oil crisis; (3) the third world debt crisis of 1981; (4) the crash of October 1987; (5) the bursting of the dot-com bubble in 2000; and, (6) the sub-prime/euro crisis commencing in 2007. They also consider eight regional crises during 1977 through 2000. They calculate momentum returns for each asset class by each month weighting constituent contract series proportionally to their excess return over the past one to 12 months and inversely to an estimate of their volatility based on lagged data. They include estimates of transaction costs proportional to the value traded that vary by asset class and time period. They also incorporate management and incentive fees (based on high water mark) of 2% and 20%, respectively. Using actual and modeled futures prices encompassing 21 equity indexes, 13 government bonds, nine currency exchange rates and 21 commodities (and contemporaneous risk-free rates) during January 1921 through June 2013, they find that:
- Over the entire sample period, the fully diversified trend-following futures portfolio generates an average net annual excess return (relative to the risk-free rate) of 12.1%, with annual volatility 11.0% for a net annual Sharpe ratio 1.1 (see the first chart below).
- The equity and bond asset classes outperform the currency and commodity classes.
- Correlation of returns with those of an index of trend-following Commodity Trading Advisors since 2000 is 0.76, suggesting that the portfolio reasonably captures recent actual experience.
- Since 1980, the portfolio generates an average net annual excess return of only 6.5%, with annual volatility 9.2% for a net annual Sharpe ratio of 0.71.
- The portfolio does not produce a positive net cumulative excess return over the last 52 months of the sample period.
- Subsequent to global financial crises, trend-following performance tends to be weak for about four years.
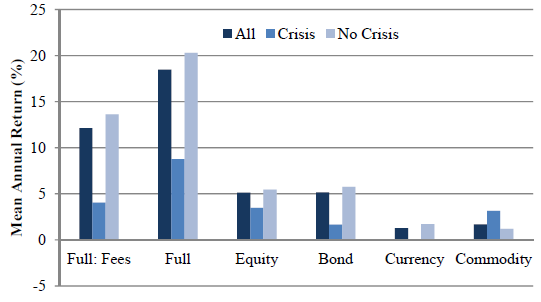
- During the 24 (48) months after crises, the fully diversified portfolio generates an average net annual excess return of 4.0% (6.0%), versus 13.6% (14.9%) during other months.
- These results are consistent for the contributions from equity, bond and currency asset classes (see the second chart below). However, commodity futures generate similar returns during and between crises.
- Poor performance during crises is generally due to flat performance rather than large drawdowns.
- In aggregate, results for regional crises are similar (but with high dispersion).
- Between global crises, futures market returns exhibit strong positive autocorrelations for lags up to 12 months. During crises, autocorrelations are significantly lower and sometimes negative.
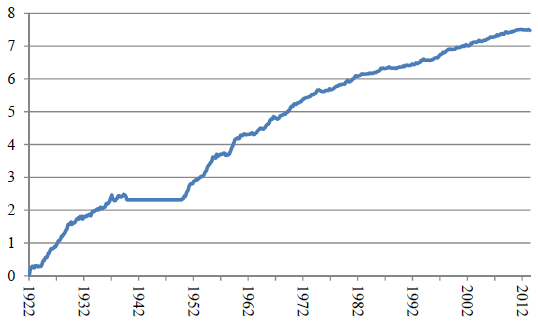
The following chart, taken from the paper, shows the net cumulative performance of the fully diversified trend-following portfolio of futures during January 1922 through June 2013. Net means inclusive of estimated transaction costs and management/incentive fees. The authors model a futures market from spot price behaviors during much of the sample period, omitting the decade around World War II (1940 through 1949) due to concerns about data accuracy.
While the trend is generally positive, results suggest the possibility of market adaptation to the existence of a growing futures market in the latter part of the sample period.
The next chart, also from the paper, shows average annual returns for all years (All), for two-year intervals after global financial crises (Crisis) and for other years (No Crisis) over the entire sample period. All results include transaction costs, with segmentation for: the entire portfolio with management/incentive fees (Full: Fees); the entire portfolio without management/incentive fees (Full); and, the contributions to Full: Fees by asset class (Equity, Bond, Currency, Commodity).
Results show that the entire portfolio and three of four asset classes are substantially stronger during non-crisis years than during crisis intervals. Results are generally similar assuming four-year (rather than two-year) crisis intervals and for the subsample since 1980.

In summary, evidence indicates that trend-following strategies as applied to futures contract series break down for most asset classes for up to four years after global financial crises.
Cautions regarding findings include:
- The sample of financial crises is not large.
- Modeling of futures markets in the early part of the sample period essentially assumes existence of data collection and processing capabilities, and an associated financial industry infrastructure, that did not exist. This modeled market subperiod does not reflect feedback from trading and the associated potential for market adaptation due to competition for returns.
- Estimates of trading frictions and fees for the part of the sample period during which there is no futures market are particularly abstract.
- Some investors may not be able to achieve the level of trading frictions specified in the study for the recent part of the sample period. A sensitivity test of performance versus level of assumed transaction costs would be helpful.