A subscriber asked about extending “Simple Momentum Strategy Applied to TSP Funds” back in time to 1988. That test employs the following five funds, all available to U.S. federal government employees via the Thrift Savings Plan (TSP) as of January 2001:
G Fund: Government Securities Investment Fund (G)
F Fund: Fixed Income Index Investment Fund (F)
C Fund: Common Stock Index Investment Fund (C)
S Fund: Small Cap Stock Index Investment Fund (S)
I Fund: International Stock Index Investment Fund (I)
S Fund and I Fund data limit the combined sample period. To extend the test back to first availability of G Fund, F Fund and C Fund data in February 1988, we use Vanguard Small Cap Index Investors Fund (NAESX) as a proxy for the S Fund and Vanguard International Value Investors Fund (VTRIX) as a proxy for the I Fund prior to 2001. We first perform a sensitivity test of fund ranking (lookback) intervals ranging from one to 12 months on the following monthly reformed portfolios: the winner fund (Top 1); an equally weighting of the top two funds (EW top 2); an equally weighting of the Top 3 funds (EW Top 3); and, an equal weighting of all five funds (EW All). We then perform detailed tests using a representative lookback interval. Using monthly returns for the five TSP funds as available during February 1988 through June 2017 (351 months) and monthly returns for NAESX and VTRIX during February 1988 through December 2000, we find that:
During January 2001 through June 2017, the correlation of monthly returns between NAESX and S Fund (VTRIX and I Fund) is 0.98 (0.98), indicating that the former is a reasonable proxy for the latter prior to January 2001.
Portfolio performance calculations assume:
- Reallocation at the monthly close (accurate estimates of past total returns for the funds are available just before any monthly fund switching deadline).
- Fund switching is frictionless.
- There are no tax implications of switching.
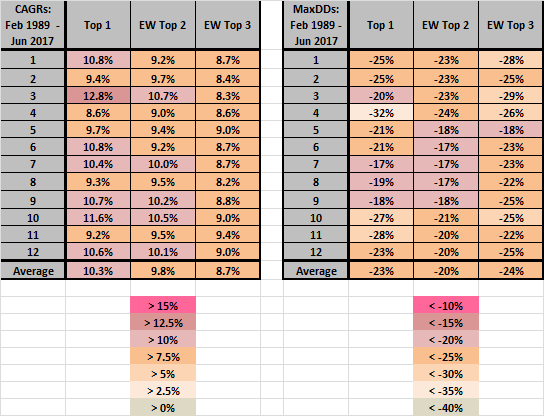
The following color-coded tables compare compound annual growth rates (CAGR) and maximum drawdowns (MaxDD) of Top 1, EW Top 2 and EW Top 3 portfolios over the sample period for lookback intervals ranging from one to 12 months (left column of each table). First monthly returns used are for February 1989 to accommodate the longest lookback interval. Notable points are:
- Unlike findings in “SACEMS Applied to Mutual Funds”, Top 1 on average works better than EW Top 2, which on average works better than EW Top 3. The difference in findings may derive from the limited asset class diversification offered by the five TSP funds.
- There are no obvious performance patterns across lookback intervals. For example, based on CAGR, two weak lookback intervals (two and four months) bracket the best (three months) .
- Experimentation with lookback intervals without supporting theory introduces data snooping bias.
Because it is least burdensome and close to representative (and perhaps least dependent on past return estimation), we choose a 12-month lookback interval for detailed analysis.
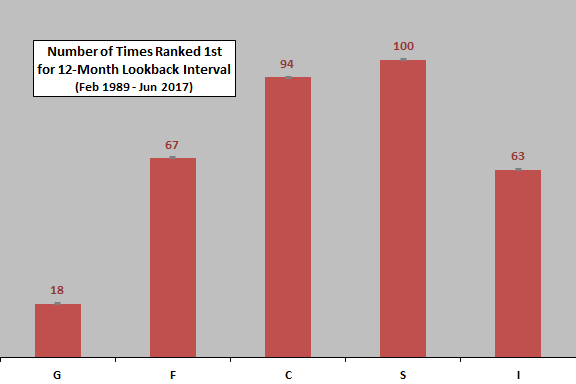
What is the distribution of fund winners based on a 12-month lookback interval?
The following chart summarizes the distribution of winner funds over the test period based on a 12-month lookback interval. Results suggest that the G fund is least important.
Does momentum effectively pick funds that perform well the next month?
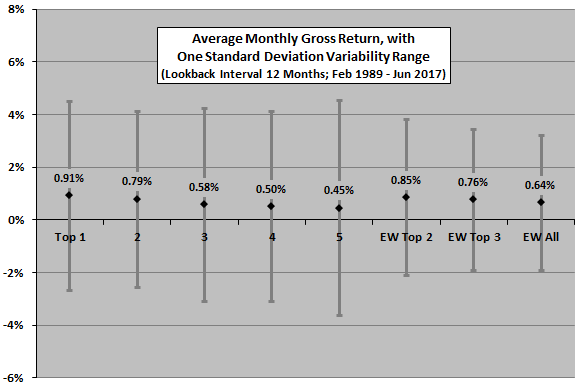
The next chart compares average monthly returns with one standard deviation variability ranges across momentum ranks one through five and, for comparison, across EW Top 2, EW Top 3 and EW All based on a 12-month lookback interval over the test period. Notable points are:
- Ranks one through five have progressively lower average monthly returns.
- Diversification across ranks suppresses volatility.
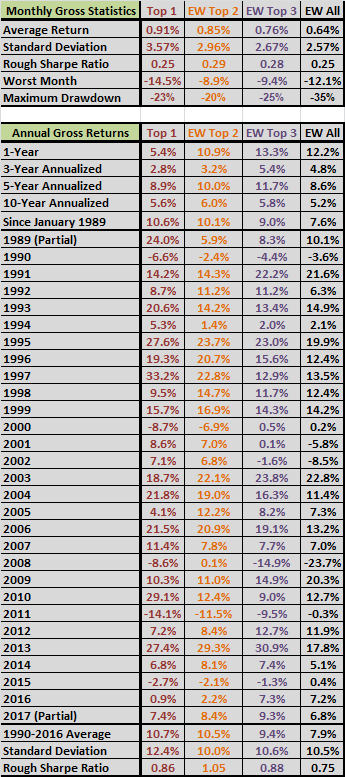
Rough monthly Sharpe ratios (average return divided by standard deviation of returns) across ranks range from 0.11 for rank five to 0.25 for rank 1. Rough gross monthly Sharpe ratios for EW Top 2, EW Top 3 and EW All are 0.29, 0.28 and 0.25, respectively.
For another perspective, we look at cumulative performances.
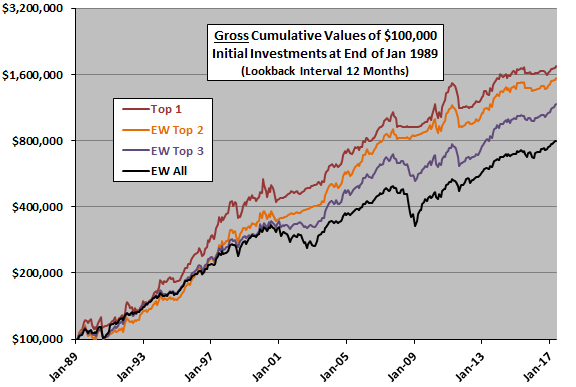
The next chart compares gross cumulative values of $100,000 initial investments in Top 1, EW Top 2 and EW Top 3 based on a 12-month lookback interval, and EW All as a benchmark, over the test period. Notable results are:
- As indicated above, Top 1 performs best based on terminal value.
- All of Top 1, EW Top 2 and EW Top 3 beat EW All.
CAGRs for Top 1, EW Top 2, EW Top 3 and EW All are 10.6%, 10.1%, 9.0% and 7.6%, respectively. Associated MaxDDs are -23%, -20%, -25% and -35%.
Rough annual Sharpe ratios for full years 1990 through 2016 for Top 1, EW Top 2, EW Top 3 and EW All are 0.86, 1.05, 0.88 and 0.75, respectively.
The sample is not long for calculation of annual performance statistics, and Sharpe ratio penalizes both upside and downside volatilities.
Is the momentum effect consistent over time?
The final chart shows Top 1 monthly return based on a 12-month lookback interval minus EW All monthly return by month over the sample period, along with a best-fit linear trend line. Results indicate that the ability of 12-month past return to pick next-month winners is generally positive but declining over the test period. The test period is not long in terms of variety of market conditions (especially number of equity bull and bear states).

For reference, the following tables summarize gross monthly and annual performance statistics cited above for a 12-month lookback interval.
In summary, applying the SACEMS methodology to a very small universe of TSP funds supports belief in its usefulness, but the limited TSP diversification potential appears to affect choice of lookback interval and number of assets held.
Cautions regarding findings include:
- Narrowness of TSP fund choices may limit momentum strategy resilience. For example, during a bond bear market (rising interest rates), there is no escape from any weakness in equities.
- As noted, performance of the best lookback interval based on trying them all impounds data snooping bias (luck) and therefore overstates expected performance. Similarly, the selection of the optimal number of funds to hold incorporates some luck. The 12-month interval selected for detailed analysis is non-optimal, thereby mitigating this caution.
- Sample size is moderate (about 28 independent 12-month lookback intervals). As noted, the sample is not long in terms of any underlying market/economic cycles that may drive asset class advances and declines.
- Anticipation of monthly rankings may be problematic for TSP funds due to a lag in availability of return data.
- If any TSP funds have been discontinued over the test period, there could be some survivorship bias in results.