Stock price momentum strategies sometime crash, greatly detracting from long-term performance. Is there a reliable way to avoid the crashes? In the April 2012 version of their paper entitled “Managing the Risk of Momentum”, Pedro Barroso and Pedro Santa-Clara investigate usefulness of momentum portfolio volatility as a crash protection signal. They construct a momentum portfolio return series based on equal allocations to the risk-free asset (one-month Treasury bill), a value-weighted long side of momentum winners and a value-weighted short side of momentum losers, reformed and rebalanced monthly. They measure momentum for all NYSE/AMEX/NASDAQ stocks based on 11-month lagged returns plus a skip-month, and define winners and losers based on the top and bottom decile cutoffs for NYSE stock momentum. Using daily and monthly momentum portfolio returns and monthly U.S. equity risk factors (market, size, book-to-market) based on stock prices for July 1926 through December 2011, they find that:
- Over the entire sample period, the specified momentum portfolio generates an average gross abnormal (adjusting for market, size and book-to-market factors) return of 1.75% per month (21% per year).
- However, the return distribution for this portfolio has a very fat left tail (material crash risk), making it unappealing to risk-averse investors. For example, during July-August 1932 and March-May 2009, the portfolio loses 91.6% and 73.4% of its value, respectively.
- Two aspects of momentum portfolio return volatility support its use in constructing a crash protection signal:
- It is highly persistent, with an R-squared of 0.58 for a monthly autoregression (portfolio volatility last month explains 58% of portfolio volatility next month).
- It is substantially distinct from overall stock market volatility, which accounts for only 23% of momentum portfolio volatility.
- Scaling the monthly long-short allocations in the specified momentum portfolio according to the inverse of the volatility of its daily returns over the past six months (with annualized volatility target 12%) greatly enhances its performance over the sample period:
- Average annualized gross return increases from 14.5% to 16.5%.
- Standard deviation of annual gross returns decreases from 27.5% to 17.0%.
- Gross Sharpe ratio nearly doubles from 0.53 to 0.97.
- Worst one-month gross return improves from -80.0% to -28.4%.
- Worst annual gross drawdown improves from -97.0% to -45.2%.
- Results are generally robust to other ways of measuring realized volatility of the momentum portfolio.
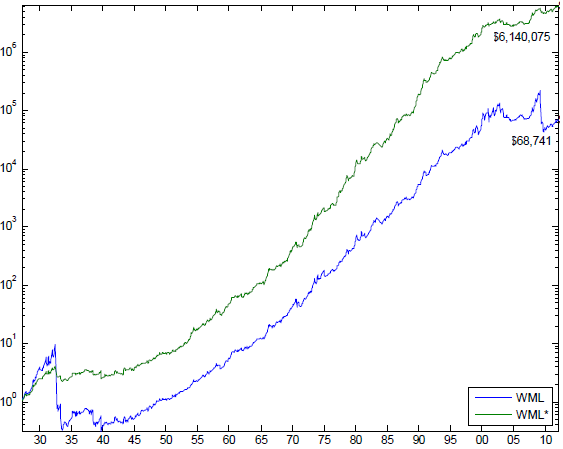
The following chart, taken from the paper, compares on a logarithmic scale the long-run gross cumulative performance of $1 initial investments in: (1) the baseline momentum portfolio as described above (WML); and, (2) the portfolio with crash protection based on scaling long and short sides according to the inverse of daily portfolio volatility over the previous six months with an annualized volatility target of 12% (WML*). The chart shows that the latter outperforms largely by avoiding much of the impacts of a few momentum crashes, dramatically improving terminal value from $68,741 to $6,140,075.

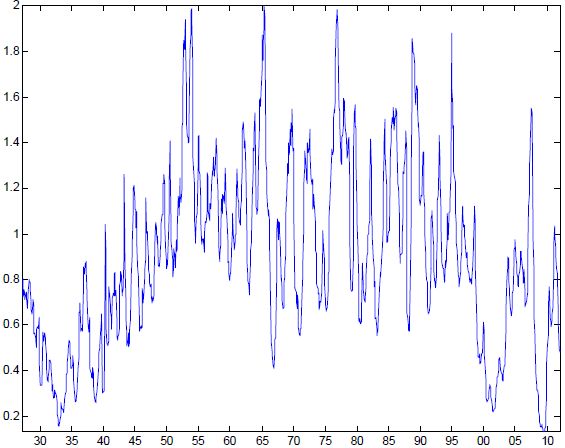
The next chart, also from the paper, summarizes values of the monthly scale factor applied to the long and short sides of the momentum portfolio with crash protection over the sample period, as derived from inverse of the volatility of daily portfolio returns over the previous six months and an annualized volatility target of 12%. The scale factor has an average value of 0.90 and a range of 0.13 to 2.00, with lows evident during the early 1930s, 2000-02 and 2008-09.

In summary, evidence suggests that scaling investment in a hedged momentum portfolio of individual U.S. stocks based on the inverse of lagged volatility of the momentum portfolio (not the market) substantially boosts performance, mostly via crash avoidance.
Cautions regarding findings include:
- Reported returns are gross, not net. Momentum strategies tend to generate high portfolio turnover, and changing monthly leverage would amplify turnover and associated trading frictions. Large dispositions down to very low values of the scale factor may occur when the U.S. equity market is highly illiquid and trading frictions are extremely high.
- The study does not consider the cost and feasibility of shorting losers.
- The paper states: “As WML [the specified momentum portfolio] is a zero-investment and self- financing strategy we can scale it without constraints.” However, the market may place constraints on long-short position size in the form of trading friction (bid-ask spread and impact of trading on price) and availability of shares for shorting. For a long-only strategy, portfolio management would be problematic in terms of both capital reserve and cost of leverage.
- While much of benefit comes from avoiding big crashes, there are (by definition) very few big crashes for testing. Very small samples undermine confident inference and elevate any data snooping bias derived from exploring alternative crash protection signals.