Is stock price all-time high a consistently effective trigger for trend following? In their January 2025 paper entitled "Does Trend-Following Still Work on Stocks?", Carlo Zarattini, Alberto Pagani and Cole Wilcox revisit and extend the results of prior 2005 research on long-only trend following based on stock price all-time high that used 1980-2004 data. They assemble survivorship bias-free data for all liquid U.S. stocks backward through 1950 and forward through November 2024. They define liquid as unadjusted closing price above $10 and 42-trading day average dollar volume over $1 million (adjusted downward for past years based on inflation) at the time of portfolio reformation. Their trading/rebalancing rules are:
- For each qualifying stock not in the portfolio, if the daily adjusted close (considering splits and dividends) reaches or exceeds its all-time high, buy the stock at the next open.
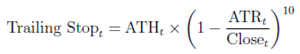
- For each stock in the portfolio, if the daily close is below the daily stop-loss level, sell the stock at the next open. The daily stop-loss level is either the previous stop-loss or, if higher, a new stop-loss computed from the All-Time High price (ATH) and 42-day Average True Range (ATR) at the most recent close, as follows:
For portfolio testing, they focus on Russell 3000 stocks from 1991 through the end of the sample period. They use 42-trading day actual volatilities to set position sizes for selected stocks to achieve approximately equal expected contributions to a 30% annualized portfolio target volatility. They allow up to 200% leverage to achieve these positions sizes, with adjustment to position size when higher leverage is indicated. They recompute stock weights at each close to reflect new portfolio entries and exits and changes in expected stock volatilities. They assume frictions/costs that cover broker commissions, slippage (impact of trading) and interest/borrowing costs. Using daily interest rates and daily prices, dividends and other price adjustments for a broad sample of U.S. stocks during January 1950 through October 2024, they find that:
Subscribe to Keep Reading
Get the research edge serious investors rely on.
- 1,200+ research articles
- Monthly strategy signals
- 20+ years of backtested analysis
Cancel anytime