The Simple Asset Class ETF Momentum Strategy (SACEMS) each month picks winners based on total return over a specified ranking (lookback) interval from the following eight asset class exchange-traded funds (ETF), plus cash:
PowerShares DB Commodity Index Tracking (DBC)
iShares MSCI Emerging Markets Index (EEM)
iShares MSCI EAFE Index (EFA)
SPDR Gold Shares (GLD)
iShares Russell 2000 Index (IWM)
SPDR S&P 500 (SPY)
iShares Barclays 20+ Year Treasury Bond (TLT)
Vanguard REIT ETF (VNQ)
3-month Treasury bills (Cash)
This set of ETFs offers: (1) opportunities to capture momentum across global developed and emerging equity markets, large and small U.S. equities, bonds and commodities; (2) gold and cash as safe havens; (3) histories long enough for backtesting across multiple market environments; and, (4) simplicity of computation and recognition of the trade-off between number of ETFs and trading frictions. As historical data accumulate, we can estimate an increasingly robust optimal lookback interval. Should we change the baseline lookback interval at this point? To investigate, we revisit relevant analyses and conduct further robustness tests, with focus on the equal-weighted (EW) Top 3 SACEMS portfolio. Using monthly dividend-adjusted closing prices for asset class proxies and the yield for Cash during February 2006 (when all ETFs are first available) through December 2018, we find that:
We consider the following past analyses:
- Per “Momentum Strategy (SACEMS)”, the best lookback intervals based on gross compound annual growth rate (CAGR) and maximum drawdown (MaxDD) are in the range two to six months.
- Per the final test in “Robustness of SACEMS Based on Sharpe Ratio”, the 4-month lookback interval is currently optimal based on gross CAGR and MaxDD.
- Per the first set of tables in “SACEMS Applied to Mutual Funds”, a 4-month lookback interval works well in a relatively long test using mutual funds matched to the SACEMS ETFs.
- Per “Optimal Intrinsic Momentum and SMA Intervals Across Asset Classes”, a 4-month lookback interval is on average optimal based on net CAGR and MaxDD for intrinsic (time series or absolute) momentum across SACEMS asset class proxies.
Qualitatively, due to accelerating movement of data and increasing use of algorithmic trading, inter-asset class dynamics seem more likely to speed up than slow down in the future.
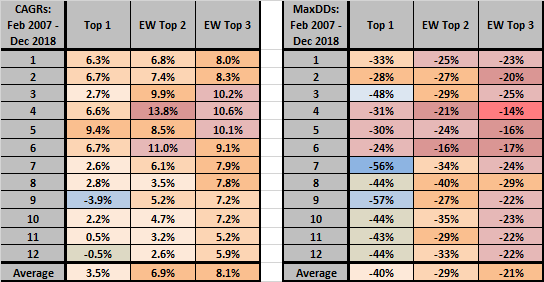
First we update the lookback interval sensitivity test. The following tables map CAGRs (left table) and MaxDDs (right table) for SACEMS Top 1, EW Top 2 and EW Top 3 portfolios for lookback intervals ranging from one to 12 months. All calculations start at the end of February 2007 to include all ETFs for the longest lookback interval.
Results confirm that best performances cluster among relatively short lookback intervals (three to six months) and within the most diversified portfolio (EW Top 3). Across portfolios, the 5-month lookback interval generates the most even performance.
Based on these findings, we run further contests among 3-month, 4-month and 5-month lookback intervals as applied to the SACEMS EW Top 3 portfolio.
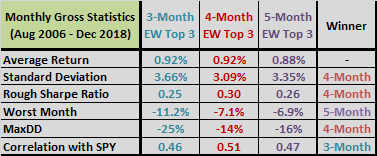
The next table summarizes SACEMS EW Top 3 monthly performance statistics for 3-month, 4-month and 5-month lookback intervals since August 2006 (the first month data support the 5-month interval), including MaxDD based on monthly data. Rough Sharpe ratio is average return divided by standard deviation of returns. The rightmost column indicates which lookback interval wins each metric. The 4-month interval appears most attractive from this perspective due mostly to lower return variability.
Next we look at annual performance data.
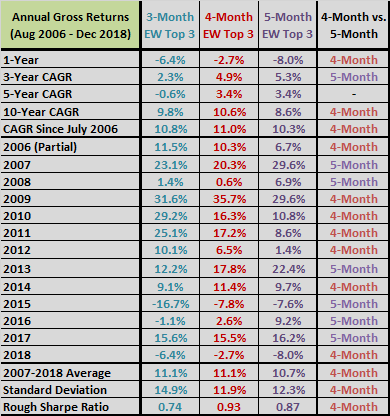
The next table summarizes SACEMS EW Top 3 annual performance statistics for 3-month, 4-month and 5-month lookback intervals since the end of July 2006. Rough Sharpe ratio is again average return divided by standard deviation of returns. Because the annual volatility of the 3-month interval is substantially highest, the rightmost column here compares only 4-month and 5-month lookback intervals. The 4-month interval appears more attractive than the 5-month interval from this perspective, but the latter beats the former in five of 13 years, including four of the last six years.
For additional perspective, we look at cumulative performance.
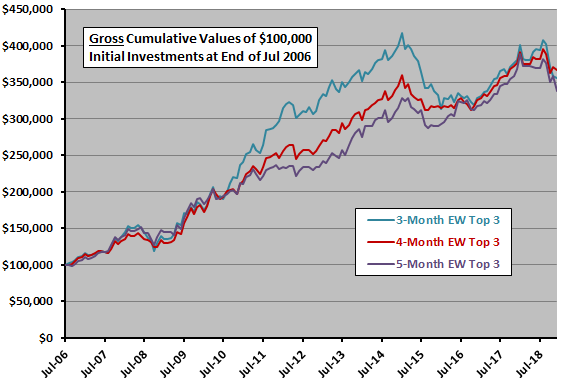
The following chart compares gross cumulative values of $100,000 initial investments in SACEMS EW Top 3 for 3-month, 4-month and 5-month lookback intervals since the end of July 2006. Notable points are:
- All three are fairly safe during the 2008-2009 financial crisis.
- During the middle period, shorter works better than longer.
- In the last few years, the 3-month interval suffers MaxDD, followed by relatively close tracking of the three alternatives.
- With the lead changing several times, the available sample period is not long enough for confident discrimination.
Overall, results suggest that drawdown-averse investors would probably prefer the 4-month lookback interval.
Looking under the hood, we examine average returns by momentum rank.
The next chart compares average gross next-month returns by SACEMS rank for 3-month, 4-month and 5-month lookback intervals since August 2006. Results suggest that:
- All three lookback intervals are reasonably, but imperfectly, effective at sorting next-month returns by rank. The best-fit linear trend line across ranks is steepest for the 4-month interval, but differences in slopes are small.
- The much higher returns for rank 2 compared to rank 1 for the 3-month and 4-month intervals are discomforting with respect to forecast precision. A possible interpretation is that the 4-month rank 1 (2) is unlucky (lucky), with bad and good luck offsetting in the EW Top 3 portfolio.
Digging deeper, we look at differences in allocations between 4-month and 5-month intervals.
![]()
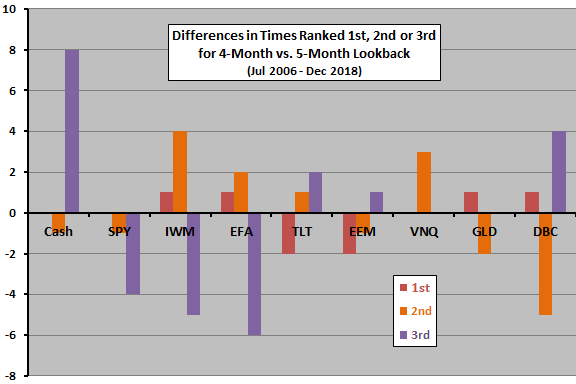
The next chart summarizes the number of times the 4-month interval ranks each asset in first, second and third places minus the number of times the 5-month interval ranks them in the same places over the available sample period. Compared to the 5-month interval, the 4-month interval:
- Picks IWM and VNQ more and DBC less in second place.
- Picks Cash more and SPY, IWM and EFA less in third place.
Overall, the shift from equities to Cash in third place seems to explain the relatively low volatility of EW Top 3 portfolio with 4-month lookback interval.
Next, we look for a trend in relative performance of 4-month and 5-month intervals.
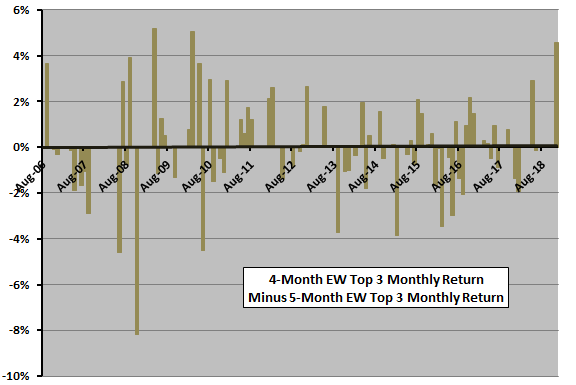
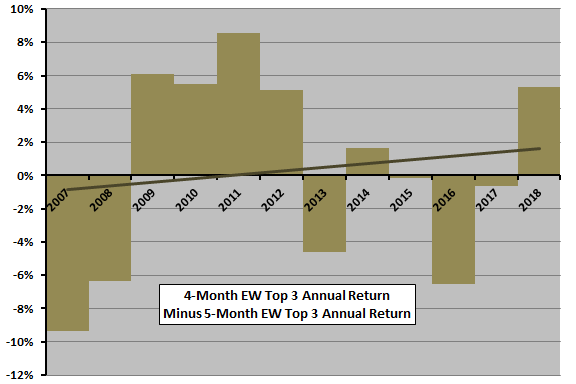
The next two charts show differences in gross monthly (upper chart) and annual (lower chart) returns between 4-month EW Top 3 and 5-month EW Top 3 over available sample periods, along with best-fit linear trend lines. Notable points are:
- Both trend lines slope upward, suggesting that outperformance of the 4-month interval is increasing.
- However, the monthly trend line slope is tiny, and the lumpiness of annual relative performance indicates that the sample is too short for confident comparison.
Next, we look at effects on combining SACEMS with the Simple Asset Class ETF Value Strategy (SACEVS).
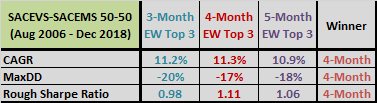
The final table compares CAGRs, MaxDDs and rough annual Sharpe ratios for the combined 50% SACEVS Best Value and 50% SACEMS EW Top 3 (SACEVS-SACEMS 50-50) for 3-month, 4-month and 5-month SACEMS lookback intervals over the available sample period. The rightmost column indicates which lookback interval wins each metric. Unsurprisingly, the advantages of the 4-month interval found above carry over to SACEVS-SACEMS 50-50.
Next, we consider trading frictions.
While all lookback intervals bear portfolio reformation frictions, shorter intervals tend to switch more frequently than longer ones. During the 150 months from July 2006 through December 2018, average numbers of annual switches into/out of the SACEMS top three are 12.3, 10.8 and 8.9 for 3-month, 4-month and 5-month lookback intervals, respectively. Associated differences in trading frictions are not decisive.
Finally, note that when we selected the 5-month lookback interval as the baseline in September 2012:
- The 2008-2009 market crash represented a much larger proportion of the sample, with attendant risk that the optimal lookback interval overfitted that event.
- The sample for full EW Top 3 analysis was only half as long as now.
In summary, evidence in favor of changing the lookback interval for SACEMS from five months to four months appears strong enough to justify doing it.
Implementation considerations are:
- This change has no effect on current allocations, because 4-month and 5-month lookback intervals choose the same winners for January 2019.
- We are replacing performance data in “Momentum Strategy (SACEMS)” and “Combined Value-Momentum Strategy” with those based on a 4-month lookback interval.
- We will over time update supporting research in “Momentum Strategy (SACEMS)” to reflect the change in baseline lookback interval.
Cautions regarding findings include:
- As noted, findings are generally gross, not net. However, also as noted, differences in number of switches among the most interesting lookback intervals are not decisive.
- Analyses are in-sample, using all available data to get the best forward-looking parameter setting. It is clear in some of the above tables and charts that an investor operating in real time would have selected different lookback intervals as optimal at different points in the time series. Available ETF samples are not long enough for useful out-of-sample testing.
- Testing many lookback intervals on the same sample introduces data snooping bias, such that the best-performing intervals overstate expectations. While the best expectation is still the best, snooping undermines conviction.
- An option to selection of an optimal lookback interval is to employ a combination of several lookback intervals. Since there are more combinations than there are individual lookback interval, this approach represents and opportunity for much more data snooping.