Does incorporation of stock price acceleration boost the performance of a conventional momentum strategy? In their July 2017 paper entitled “Evolution of Historical Prices in Momentum Investing”, Li-Wen Chen, Hsin-Yi Yu and Wen-Kai Wang examine whether stock price acceleration adds value to a conventional momentum strategy among U.S. stocks by identifying the best winners and the worst losers. They focus on a stock ranking interval of 12 months and a portfolio holding interval of six months, with a skip-month between. Specifically, they each month:
- Rank stocks into fifths (quintiles) based on past 12-month returns. The top (bottom) quintile holds winners (losers).
- Fit daily time series prices over the same past 12 months for each stock to a quadratic equation and re-rank stocks within past return quintiles by the coefficient of the quadratic term, resulting in 25 portfolios sorted by past return and quadratic coefficient. A positive (negative) coefficient means that price is accelerating up (down).
- Skip one month.
- Compare three value-weighted hedge portfolios held over the next six months to highlight the incremental effect of the quadratic coefficient on conventional momentum:
- Conventional: buy winners and sell losers.
- Acceleration: buy accelerating winners and sell accelerating losers.
- Deceleration: buy decelerating winners and sell decelerating losers.
The monthly return for each strategy is the average return for its six overlapping portfolios. Using daily and monthly returns, characteristics and accounting data for a broad sample of U.S. common stocks with price at least $5 during January 1962 through December 2014, they find that:
- The acceleration (deceleration) strategy outperforms (underperforms) conventional momentum. Average gross monthly returns and gross monthly Sharpe ratios are:
- Conventional: 0.63% and 0.12.
- Acceleration: 0.95% and 0.17.
- Deceleration: 0.50% and 0.09.
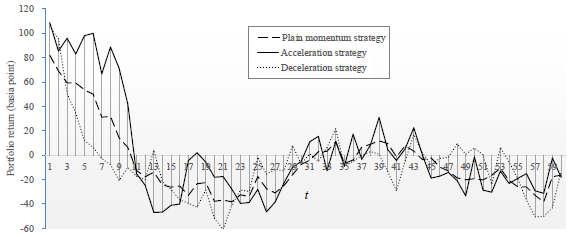
- The acceleration strategy is more persistent than conventional momentum, while the deceleration strategy is less persistent (see the chart below).
- Accelerating winners tend to have higher book-to-market ratios (BM), higher liquidities, higher turnovers, smaller volumes and bigger earnings surprises than decelerating winners. Accelerating losers tend to have smaller market capitalizations, lower book-to-market ratios, higher idiosyncratic volatilities, higher turnovers and smaller earnings surprises than decelerating losers.
- Controlling for past returns has little effect on findings, meaning that the acceleration strategy is not simply a finer partition of past returns. Nor is the acceleration boost explained by effects such as 52-week high prices, earnings surprises, turnovers, idiosyncratic volatilities and intermediate-term past returns.
- Momentum traders are probably overreacting extrapolators.
The following chart, taken from the paper, compares gross returns of conventional (plain) momentum, acceleration and deceleration strategies by month for holding intervals up to 60 months. Results indicate that:
- During the first and second months after portfolio formation, both acceleration and deceleration beat conventional momentum.
- Acceleration (deceleration) is more (less) persistent than conventional momentum. Acceleration beats conventional momentum during each of the first 10 months after portfolio formation.
- Returns of all three strategies tend toward long-term reversal or negligible returns after the first 10 months.

In summary, evidence indicates that a price acceleration overlay boosts the performance of a conventional stock momentum strategy.
Cautions regarding findings include:
- Reported returns are gross, not net. Accounting for semiannual portfolio reformation frictions and shorting costs would reduce returns. Shorting of some stocks as specified may be problematic due to lack of shares to borrow.
- The selected ranking interval inherits data snooping bias, thereby overstating expectations. Specifications for measuring price acceleration/deceleration may introduce additional snooping bias.
- The chart indicates that acceleration and deceleration strategies perform similarly for holding intervals of one or two months, undermining overall findings.
- Data collection/processing/portfolio maintenance requirements are beyond the reach of some investors, who would bear fees for delegating to a fund manager.
See also the “Return Acceleration More Effective than Momentum?” and especially “Stock Price Acceleration as a Momentum Investing Enhancement”