Is stock factor timing attractive? In their September 2016 paper entitled “Timing ‘Smart Beta’ Strategies? Of Course! Buy Low, Sell High!”, Robert Arnott, Noah Beck and Vitali Kalesnik investigate whether timing of stock factor (long-short) and smart beta (long-only) strategies is attractive. They consider eight widely used factors and eight smart beta strategies. Each factor portfolio is long (short) the 30% of large-capitalization stocks with the highest (lowest) expected returns for that factor. They test both past returns and relative valuation (average valuation of factor long side divided by average valuation of factor short side) as timing signals. Their stock valuation metric is an aggregate of price-to-five-year-earnings, price-to-five-year-sales, price-to-five-year-dividends and price-to-book ratio, each measured relative to that of the capitalization-weighted universe of stocks. They standardize relative valuations across factors by dividing the difference between a current relative valuation and its past average relative valuation by the standard deviation of its past relative valuations. For factor timing portfolios, their benchmark is the equally weighted average of factor portfolio returns. For smart beta strategies, their benchmark is the capitalization weighted stock universe. They ignore frictions and shorting costs involved in portfolio maintenance. Using inputs as specified in factor and smart beta definitions during January 1977 through August 2016, they find that:
- The benchmark portfolio of:
- Eight equally weighted factors generates gross annualized return 2.4%, with gross annual Sharpe ratio 0.52.
- Eight equally weighted smart beta strategies outperforms capitalization weighting by a gross annualized 1.5% with gross annual information ratio 0.34.
- For timing based on past returns:
- A trend follower who each year picks the three factors or three smart beta strategies with the highest blended performances over the last 1, 3, 5 and 10 years substantially underperforms specified benchmarks based on both annualized return/value-add and Sharpe ratio/information ratio.
- A contrarian who each year picks the three factors or smart beta strategies with the lowest blended performances over the last 1, 3, 5 and 10 years beats specified benchmarks based on annualized return/value-add but not based on Sharpe ratio/information ratio (due to elevated volatilities of concentrated portfolios).
- Results are robust to using a single ranking interval of 1, 3, 5 or 10 years rather than a blend. Three years is both the worst ranking interval for trend followers and the best for contrarians.
- For timing based on relative valuation:
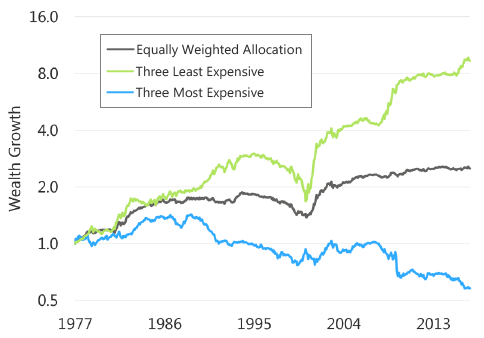
- An investor who each year picks the three cheapest (most expensive) factors per available histories outperforms (underperforms) an equally weighted allocation to all eight factors by a gross annualized 3.7% (3.5%), with a higher (much lower) Sharpe ratio. (See the chart below.)
- An investor who each year picks the three cheapest (most expensive) smart beta strategies per available histories outperforms (underperforms) an equally weighted allocation to all eight strategies by a gross annualized 0.5% (0.6%), with similar (much lower) information ratio.
- All of the eight factors and eight smart beta strategies appear in the cheapest portfolios multiple times over the sample period.
- However, aggressively selecting just the one cheapest factor or smart beta strategy severely erodes risk-adjusted performance due to high volatility.
- True (post-discovery) performances of factors and smart beta strategies are often less attractive due to: in-sample snooping; post-publication market adaptation; and, factor discovery at the cusp of mean reversion.
- The average excess return of factors is 5.8% before publication and only 2.4% after, with six of eight factors fading.
- The average excess return of the smart beta strategies is 1.8% before index launch and 1.4% after.
The following chart, taken from the paper, compares gross cumulative performances of:
- An equally weighted portfolio of all eight factors.
- The three least expensive factors based on relative valuation, reselected annually.
- The three most expensive factors based on relative valuation, reselected annually.
Portfolio 2 substantially outperforms, and portfolio 3 substantially underperforms, the equally weighted benchmark. However, portfolio 2 suffers a severe drawdown during 2000-2002.

In summary, evidence suggests that factor and smart beta portfolios exhibit valuation-driven performance predictability, thereby supporting factor timing based on relative valuation of long and short sides.
Cautions regarding findings include:
- As noted, all returns used are gross, not net (the assets are essentially indexes). Any costs involved in maintaining liquid portfolios would reduce these returns and associated risk-adjusted performances.
- Calculations of factor/smart beta relative valuations is beyond the reach of most investors, who would bear fees for delegating the calculations to an advisor.
- Per the chart above, the relative valuation factor timing approach (and the corresponding smart beta timing approach, not shown) suffers a severe drawdown during the sample period that may cause investor abandonment.
- As noted in the paper, the factor/smart beta strategy selection approach impounds aggregate investment community selection bias.
See also the following closely related items: