Is strategic asset class allocation or active management paramount for U.S. university endowment investment performance? In the October 2011 draft of their paper entitled “Do (Some) University Endowments Earn Alpha?”, Brad Barber and Guojun Wang explore the investment performance of U.S. university endowments with regard to overall alpha, performance persistence and sources of superior performance. They assess three groups of universities: Ivy League; other elite universities based on high average math SAT entrance scores; and, the balance of universities. They measure alpha as the residual return (from specific asset selection and tactical asset class allocation) after accounting for the combined returns of best-fit constant (strategic) asset class allocations to five indexes representing U.S. stocks (S&P 500 Index), non-U.S. stocks (MSCI non-U.S.), U.S. bonds (Barclays Capital Aggregate Bond Index), hedge funds (Hedge Fund Research Fund‐Weighted Composite Index) and private equity (Cambridge Associates U.S. Private Equity Index). Using annual voluntarily reported university endowment investment returns, benchmark index returns and math SAT score statistics for incoming freshmen during 1991 through 2010 (279 endowments report in all 20 years), they find that:
- Ivy League, other top-SAT and the rest of U.S. university endowments generate average annual returns of 11.5%, 10.2% and 8.2%, respectively.
- Progressively adding asset classes for discovery of alpha sources shows that:
- A two-class model portfolio of 59% U.S. stocks and 41% U.S. bonds explains 94% of time‐series variation in the return of the average endowment and indicates an overall annual alpha of only 0.06%.
- A three-class model portfolio of 42% U.S. stocks, 37% U.S. bonds and 21% non-U.S. stocks explains 99% of time‐series variation in the return of the average endowment and indicates an overall annual alpha of 0.48%.
- A five-class model portfolio of 36% U.S. stocks, 31% U.S. bonds, 12% non-U.S. stocks, 12% hedge funds and 10% private equity explains 99% of time‐series variation in the return of the average endowment and indicates an overall annual alpha of -0.82%.
- Relative to the two‐class and three‐class model portfolios:
- Ivy League endowments generate average annual alphas of 3.2% and 4.0%, other top-SAT endowments generate annual alphas of 1.9% and 2.5% and other endowments generate average annual alphas near zero.
- The top (bottom) decile of endowments based on prior-year return generate average annual alphas of 2.3% and 2.6% (‐1.6% and ‐1.4%).
- However, relative to the five-class model portfolio, Ivy League, other top‐SAT and top-decile endowments generate average annual alphas of 0.02%, -1.2% and -0.4%, respectively. These results are not consistent with superior specific asset selection or tactical asset class allocation (market timing).
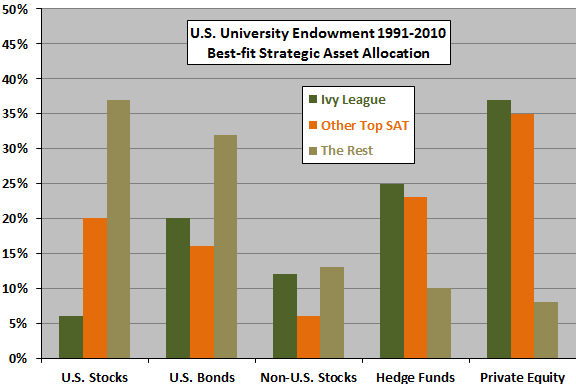
- The average endowment strategically allocates 22% of funds to hedge funds and private equity, while elite institutions allocate 50%‐60% (see the charts below).
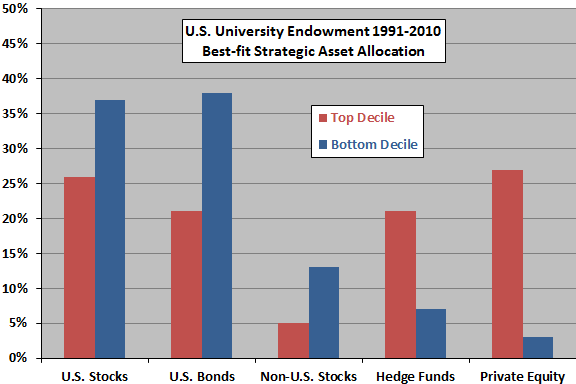
The following charts, constructed from data in the paper, summarize two perspectives on “reverse-engineered” strategic asset allocations of U.S. university endowments to U.S. Stocks, U.S. Bonds, non-U.S. Stocks, Hedge Funds and Private Equity for the period 1991 through 2010. The upper chart compares strategic allocations for the Ivy League, other universities with top average math SAT scores for incoming freshmen and the rest of the sample. The lower chart compares strategic allocations for the top and bottom deciles of investment performance. All allocations maximize explanatory power for the cross-section of endowment investment performance (R-squared statistics ranging from 0.95 to 0.99) and assume there are no missing asset classes.
These modeled allocations indicate that the best-performing endowments rely substantially on hedge funds and private equity to drive performance.


In summary, evidence from U.S. university endowment investment performance over the past two decades indicates that strategic asset allocation (with substantial allocations to alternative asset classes), rather than specific asset selection or market timing, drives superior performance.
Cautions regarding findings include:
- Good news/bad news: “…fees paid by endowments do not result in systematically low returns relative to benchmarks…” / “…investment managers do not appear to share the fruits of their labor with those whose money they manage…there is no evidence that endowments…are able to beat benchmark returns.”
- Individual investors may not be able to replicate the results of best-performing university endowments because of higher trading frictions and very limited access to alternative investments.