Should mutual fund investors go with trendy new funds? In their August 2016 paper entitled “What’s Trending? The Performance and Motivations for Mutual Fund Startups”, Jason Greene and Jeffrey Stark examine the interactions of mutual fund trendiness with growth in assets under management, fees and performance. They quantify fund trendiness by each month:
- Relating each key word found in fund names to industry fund flows over the past 12 months.
- Subtracting the average key word-flow relationship for the entire sample period from the monthly relationship to indicate current key word trendiness.
- Ranking key words by trendiness.
- Averaging the trendiness ranks for each key word in each fund name to measure fund trendiness.
They then relate fund trendiness to fund flows over the next 12 months, fund fee level at fund inception and fund performance over its first five years of existence. Using fund names and monthly fund returns, fund assets and factor returns for alpha calculations during 1993 through 2014 (7,072 distinct funds), they find that:
- Controlling for an array of potentially relevant variables, there is a positive and non-linear relationship between trendiness and inflows, driven by funds in the top quintile of trendiness. A fund at the 100th percentile of trendiness has about 10% higher inflow than one at the 80th percentile, corresponding to an average $144 million in incremental inflow.
- New fund launches concentrate in higher quintiles of trendiness (1,433 in the highest quintile, compared to 840 in the lowest quintile.
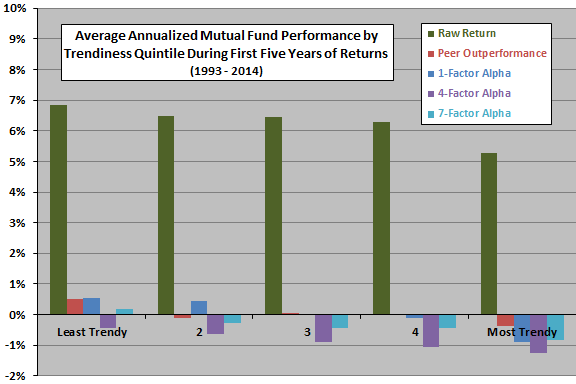
- During their first five years of existence, the most trendy quintile of funds underperform the least trendy quintile by a value-weighted 0.82% to 1.57% per year, depending on the performance metric (see the chart below). Results are robust within subsamples grouped by domestic equity, fixed income and foreign equity.
- Based on a matched size and flow subsample, underperformance of trendy funds is not due to their higher inflows.
- There is a significantly positive relationship between fund trendiness and fund fees, suggesting that sponsors understand the demand for trendiness.
The following chart, constructed from data in the paper, compares value-weighted average annualized performance by ranked fifth (quintile) of mutual fund trendiness during the first five years of fund existence over the entire sample period based on five metrics, all measured monthly:
- Raw return.
- Peer Outperformance – fund return minus value-weighted average return of other mutual funds with similar objectives.
- 1-Factor Alpha – relative to U.S. equity market factor.
- 4-Factor Alpha – relative to U.S. market, size, book-to-market and momentum factors.
- 7-Factor Alpha – adding term risk, credit (default) risk and world equity market risk factors to the 4-factor model.
There are negative relationships between trendiness and performance for all five metrics, with some effects concentrating among the most trendy stocks.

In summary, evidence suggests that some mutual fund sponsors launch trendy funds to exploit investor sentiment rather than to exploit some effective investment strategy/skill, with such funds thereby performing poorly after launch.
In other words, mutual fund investors may want to avoid new, trendy funds.
Cautions regarding findings include:
- There is look-ahead bias in the specification of key word trendiness, derived from full-sample key word-flow normalization. An investor operating in real time throughout the sample period could not calculate monthly trendiness as specified.
- The sample period includes two deep bear markets. It may be that trendy funds have high betas and suffer inordinately during these crashes.