Do documented streaks of market outperformance occur more often than would be expected by chance, thereby supporting belief in investing skill? In their August 2010 paper entitled “Differentiating Skill and Luck in Financial Markets With Streaks”, Andrew Mauboussin and Samuel Arbesman compare actual streaks of mutual fund outperformance relative to the S&P 500 Index to results of 10,000 “no-skill” simulation trials to measure whether skill exists. The simulation assumes that both the number of fund-years per year and the probability that a fund would beat the S&P 500 Index during a year are the same as observed across a large sample of active mutual funds. Using monthly returns for 5,593 actively managed, large-capitalization U.S. mutual funds spanning 1962-2008 (50,693 fund-years), they find that:
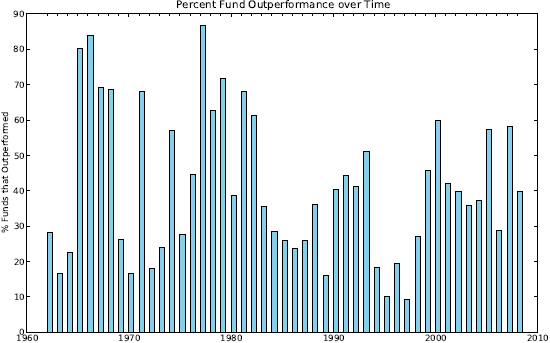
- Based on annual returns, sampled mutual funds beat the S&P 500 Index 38.2% of the time, with the frequency of outperformance varying considerably over time (see the first chart below).
- Over the entire sample there are 454 (3) outperformance streaks of at least five (ten) calendar years. The longest streak is 15 years.
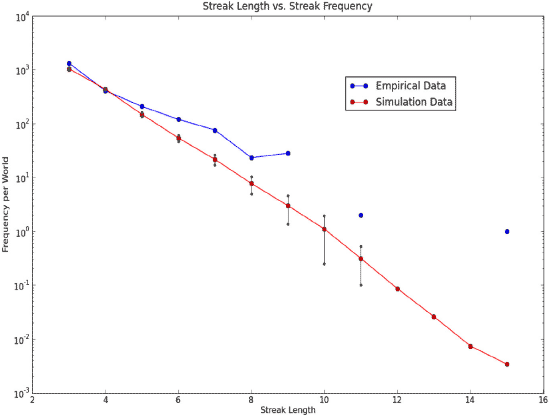
- Actual mutual fund performance exhibits significantly more streaks than generated by “no-skill” simulations (see the second chart below). Moreover, in aggregate, funds with outperformance streaks of at least seven years beat the S&P 500 Index 55.0% of the time, compared to 38.2% for all funds.
- Adding a skill component to the simulation based on a normal distribution of skill with a mean of 0% and a standard deviation of approximately 16% mimics empirical data.
- The empirical basis for the simulation, and the length of the longest outperformance streaks, make it unlikely that fund styles explain the indication of skill.
The following chart, taken from the paper, shows the frequency of outperformance by calendar year for all funds sampled. The average frequency of outperformance across all years is 38.2%. There is considerable variation in outperformance rates over the 1962-2008 sample period.

The next chart, also from the paper, compares the empirical and simulated frequencies of outperformance streaks (log scale) over the entire sample period, with one standard deviation variability ranges for simulation outcomes. It shows that outperformance streaks are systematically more prevalent in actual data than in 10,000 “no-skill” simulation trials. In other words, some factor other than pure luck is material in generating the distribution of outperformance streaks among mutual funds.

In summary, evidence from analysis of market outperformance streaks among actively managed U.S. mutual funds indicates that fund manager skill is material to fund performance.
The study does not address how to find outperformance streaks before they occur.