Can investors exploit the combination of unusual changes in hedge fund long positions and unusual changes in short interest for individual stocks? In the February 2015 version of their paper entitled “Arbitrage Trading: The Long and the Short of It”, Yong Chen, Zhi Da and Dayong Huang examine the power of three variables to predict stock returns:
- Abnormal hedge fund holdings (AHF), the current quarter aggregate hedge fund long positions in a stock divided by the total shares outstanding minus the average of this ratio over the four prior quarters.
- Abnormal short interest (ASR), the current quarter short interest in a stock divided by the total number of shares outstanding minus the average of this ratio over the four prior quarters.
- The difference between AHF and ASR as a measure of imbalance in hedge fund trading.
They also examine how AHFSR interacts with ten widely used stock return predictors: book-to-market ratio; gross profitability; operating profit; momentum; market capitalization; asset growth; investment growth; net stock issuance; accruals; and, net operating assets. To measure the effectiveness of each predictor, they each quarter rank stocks into fifths (quintiles) based on the predictor and then calculate the difference in average gross excess (relative to the risk-free rate) returns of extreme quintiles. Using quarterly hedge fund SEC Form 13F filings and short interest data for a broad sample of U.S. stocks (excluding small and low-priced stocks), along with data required to compute stock return predictors and risk factors for these stocks, during 1990 through 2012, they find that:
- Basic statistics offer support for viewing hedge fund long holdings and short interest as two sides of the same trade:
- Percentages of shares outstanding held by hedge funds or sold short increase from about 1% in early 1990s to a peak around 5% in 2008, and then fall back.
- The distributions of the two variables across stocks over the sample period are similar, with averages 3.72% and 3.49%, medians 2.37% and 2.35% and standard deviations 3.97% and 3.66%, respectively.
- The two variables exhibit a positive quarterly correlation of 0.23.
- Both AHF and ASR predict gross stock returns.
- A hedge portfolio that is each quarter long (short) the equally weighted top (bottom) AHF quintile generates an average gross monthly excess return of 0.44% over the next quarter.
- A hedge portfolio that is each quarter long (short) the equally weighted bottom (top) ASR quintile generates an average gross monthly excess return of 0.41% over the next quarter.
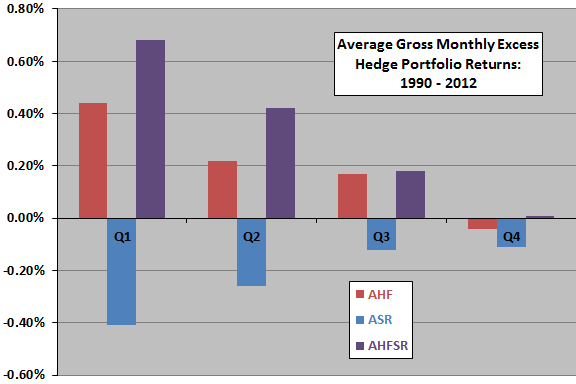
- Combining AHF and ASR strengthens predictive power (see the chart below).
- A hedge portfolio that is each quarter long (short) the equally weighted top (bottom) AHFSR quintile generates an average gross monthly return of 0.68% over the next quarter, declining to 0.42% and 0.18% during the second and third quarters.
- Stocks with high AHF and low ASR earn much higher average gross monthly returns over the next quarter (1.18%) than stocks with low AHF and high ASR (0.40%).
- Returns for the other ten predictors come exclusively from stocks with AHFSRs in the top or bottom 30%.
- Across all stocks in the sample, average gross monthly hedge portfolio returns for the other predictors are 0.28%, 0.25%, 0.20% and 0.15% during the first, second, third and fourth quarters after formation, respectively.
- For stocks in the top or bottom 30% of AHFSRs, average gross monthly returns are 0.88%, 0.61%, 0.34% and 0.27% during the first, second, third and fourth quarters after portfolio formation.
- Overall results are about equally strong during the first and second halves of the sample period, and they survive adjustment for market, size, book-to-market and momentum factors.
The following chart, constructed from data in the paper, summarizes average gross monthly excess returns for three hedge portfolios by quarter over the four quarters (Q1 through Q4) after portfolio formation. Hedge portfolios are each quarter long (short) the quintile of stocks with the highest (lowest) values of the specified variable. Results show that combining AHF and ASR increases the value of the information regarding future returns and that the value of the information in all variables fades over time.
Note that portfolio formation rules ignore a delay of up to 45 days in availability of SEC Form 13F data, such that some of the first quarter return is not exploitable.

In summary, evidence indicates that investors may be able to exploit information conveyed by unusual changes in hedge fund holdings and short interest for individual stocks over the next few months, especially when combining these two variables.
Cautions regarding findings include:
- Returns are gross, not net. Accounting for frictions of quarterly portfolio reformation and shorting costs for the hedge portfolios would reduce reported returns. Shorting specified stocks may not always be feasible.
- As noted, the authors do not account for any delay between the end of a quarter and availability of Form 13F data for that quarter, potentially overstating the level of exploitability. A hedge fund subject to the regulation must file a Form 13F “within 45 days of the end of a calendar quarter”. Persistence of effects beyond the first quarter mitigates this concern.
See the somewhat similar approach in “Exploiting Interaction of Hedge Fund Holdings and Short Interest”.