Is Warren Buffett’s track record explicable and replicable? In the June 2018 update of their paper entitled “Buffett’s Alpha”, Andrea Frazzini, David Kabiller and Lasse Pedersen model Warren Buffett’s exceptional investing performance based on replicating exposures of Berkshire Hathaway overall and of its publicly traded holdings to six factors. Four of the factors are those conventionally used to explain stock returns: market return, size, book-to-market ratio and momentum. The other two factors are betting-against-beta (buy low beta and avoid high beta) and quality (profitable, growing, dividend-paying). They further create portfolios that track Berkshire Hathaway’s factor exposures, leveraged to the same active risk as Berkshire Hathaway. Using monthly stock returns and accounting data for a broad sample of U.S. stocks, quarterly Berkshire Hathaway SEC Form 13F holdings and monthly returns for six factors specified above during October 1976 through March 2017, along with contemporaneous open-end active mutual fund performance data, they find that:
- Over the available sample period, Berkshire Hathaway (the broad U.S. stock market) has:
- Average annual return in excess of the Treasury bill yield 18.6% (7.5%).
- Annual standard deviation of returns 23.5% (15.3%).
- Annual Sharpe ratio 0.79 (0.49), highest among all stocks and mutual funds with a history of at least 40 years during 1926 through 2017.
- Berkshire Hathaway does have some rough times, such as a 44% drawdown during July 1998 through February 2000 (while the broad market gains 32%).
- Berkshire Hathaway has average leverage 1.7-to-1, partly financed at very low rates via insurance business reserves, accelerated depreciation of assets; and, cash from selling derivatives. This cheap leverage boosts returns.
- Berkshire Hathaway’s publicly traded stock holdings perform better than its wholly-owned private companies, suggesting that returns are more from stock selection than management influence.
- Berkshire Hathaway’s publicly traded holdings have market beta 0.69. They tilt against the size factor, toward the value factor and strongly toward betting-against-beta and quality factors.
- The conventional 4-factor model of stock returns explains little of Berkshire Hathaway’s alpha.
- Betting-against-beta and quality factors together almost completely explain this alpha.
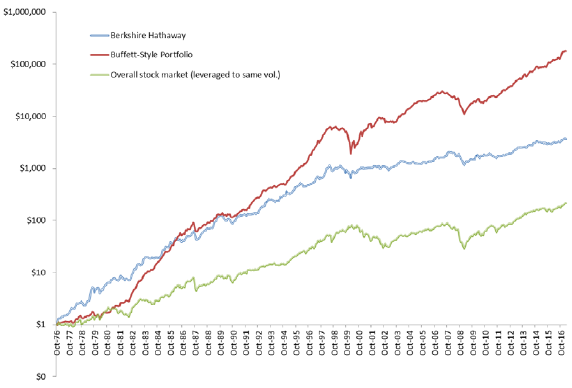
- Regarding portfolios that mimic factor exposures of Berkshire Hathaway’s publicly traded holdings (see the chart below):
- A monthly rebalanced long-short portfolio based on full sample (in-sample) monthly regressions outperforms actual holdings (gross Sharpe ratio 1.17 versus 0.74 during 1980-2017).
- A long-only, equally weighted portfolio of the 50 stocks with the highest weights from the full sample regressions performs well, but not as well as long-short (gross Sharpe ratio 0.62 during 1980-2017).
- Long-short and long-only portfolios based on out-of-sample, inception-to-date estimates of factor exposures perform similarly (gross Sharpe ratios 1.05 and 0.69 during 1985-2017).
The following chart, taken from the paper, compares cumulative performances on a logarithmic scale of:
- Berkshire Hathaway’s portfolio of publicly traded stocks as reported in its 13F filings (Berkshire Hathaway).
- A mimicking portfolio based on factor exposures from in-sample regressions (Buffett-Style Portfolio).
- The value-weighted overall stock market return, leveraged to the same volatility as Berkshire’s public stocks.
Results suggest that mimicking Berkshire Hathaway’s investing style is attractive.

In summary, evidence indicates that Warren Buffett’s exceptional investing performance derives from unique access to low-cost leverage applied to investments in safe, high-quality, cheap stocks.
Cautions regarding findings include:
- Analyses assume that Berkshire Hathaway does not change holdings during quarters between Form 13F filings.
- As noted, performances of the Form 13F-derived portfolio for Berkshire Hathaway and the mimicking Buffett-style portfolios are frictionless. Including trading frictions, which may differ across portfolios, would reduce reported returns.
- As noted, the mimicking Buffett-style portfolio is long-short. Including shorting costs would reduce its performance. Shorting may not always be feasible as specified.
See also “Warren Buffett on Investing”.